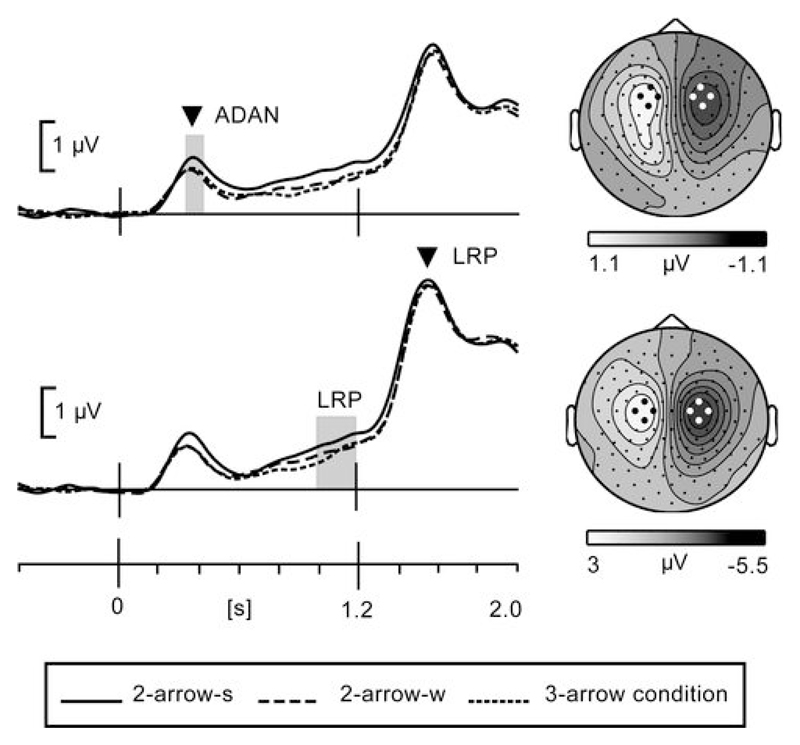
Figure 5.
ADAN and LRP potentials for Experiment 2. Scalp topographies were similar and electrode selections for ADAN and LRP were identical to selections in Experiment1. The grey bars indicate the latency windows for amplitude analysis. The arrow heads correspond to the latency of scalp topographies. LRP scalp topography is plotted at peak latency to illustrate the shift to posterior relative to ADAN topography, supporting generation in primary and premotor cortex, respectively.

