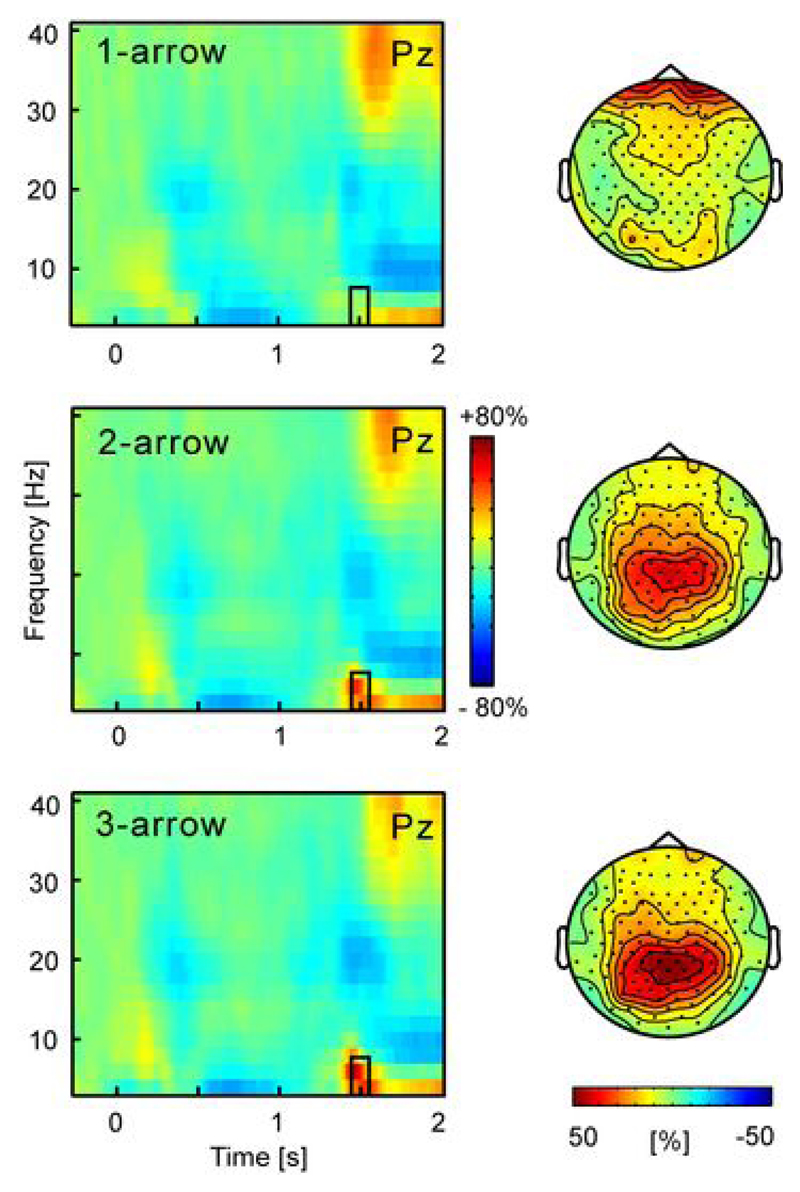
Figure 7.
Time-frequency representations for 1-, 2-, and 3-arrow conditions in Experiment 1. The colour scale indicates percentage power change relative to the baseline preceding the cue. A brief theta burst is seen to peak at 1500 ms (300 ms after response signal) and was quantified between 1450-1550 ms in the frequency range 4-8 Hz, as indicated by the black rectangle. Its scalp topography for each of the conditions is shown on the right, emphasizing a parietal maximum.

