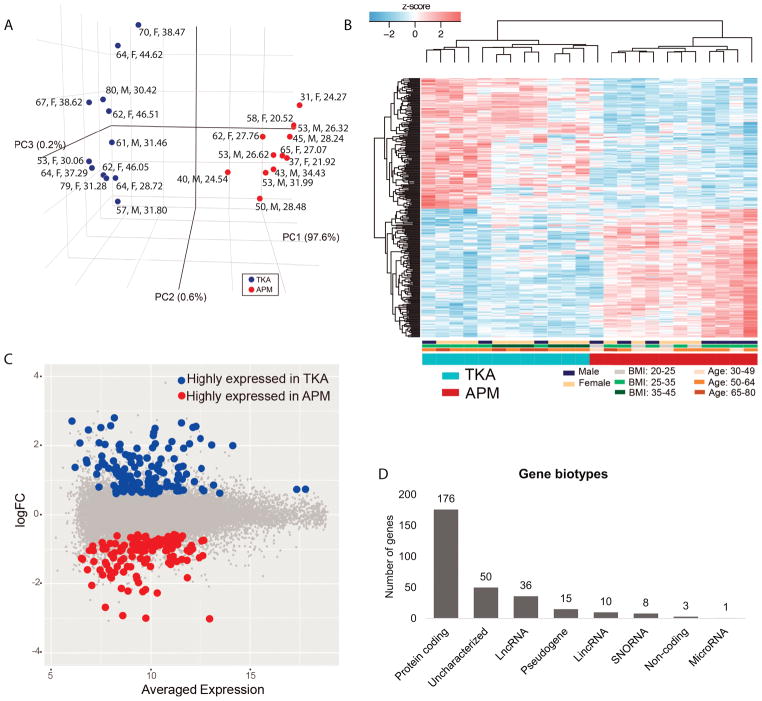
Fig. 1.
A). Principal components analysis of 12 TKA and 12 APM samples showed clear distinction between TKA and APM patients. Each dot represents one patient with age (in years), sex (F for female, M for male) B) and body mass index (BMI in kg/m2). Normalized gene expression level (z-score) of DE transcripts between TKA and APM patients were used to generate heatmaps in which condition (TKA, APM), sex (females, male), body mass index (BMI) and age were included. Color bar below heatmaps indicates patients’ metadata in which patients were mainly clustered. Based on DE transcripts, TKA and APM samples were distinctly separated. C). Expression fold-change (FC) and averaged expression level of DE transcripts between TKA and APM patients. D). A number of different biotypes of genes significantly DE between TKA and APM samples were detected.

