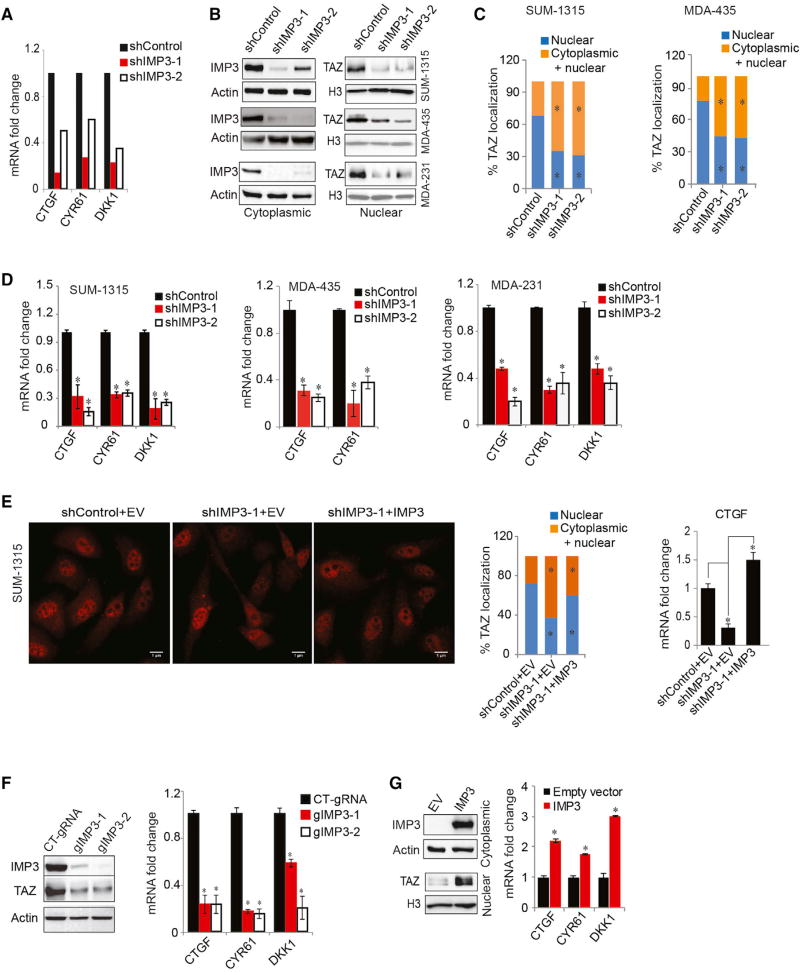
Figure 1. Causal Relationship of IMP3 and TAZ in TNBC.
(A) RNA sequencing result showing decreased expression of CTGF, CYR61, and DKK1 upon IMP3 depletion.
(B–D) Control and IMP3-depleted SUM-1315, MDA-435, and MDA-231 cells were (B) fractionated and blotted for IMP3 (cytoplasmic) and TAZ (nuclear) (actin and histone H3 were used as loading controls for cytoplasmic and nuclear proteins, respectively); (C) assessed for TAZ localization by immunofluorescence (the bar graphs show the quantification of TAZ localization in either the nucleus only or in both cytoplasm and nucleus); and (D) assayed for TAZ target gene expression by qPCR.
(E) Control and IMP3-depleted SUM-1315 cells were transfected with an empty vector (EV) or IMP3-expressing construct that is resistant to shIMP3-1 and stained for TAZ by immunofluorescence, and TAZ localization was quantified. Total RNA isolated from the same cells was used to quantify CTGF mRNA by qPCR (right bar graph). Scale bar, 1 µm.
(F) IMP3 expression was depleted using IMP3-specific guide RNAs (gIMP3-1 and gIMP3-2) in SUM-1315 cells and assayed for expression of TAZ (immunoblots) and its target genes (qPCR). A non-targeting gRNA (CT-gRNA) was used as the control.
(G) SKBR3 cells were transfected with an empty vector or a construct expressing IMP3 and fractionated and blotted for IMP3 (cytoplasmic) and TAZ (nuclear). Total RNA extracted from the same cells was used to quantify TAZ target genes using qPCR. p ≤ 0.05.
Relevant data are shown as ± SE.

