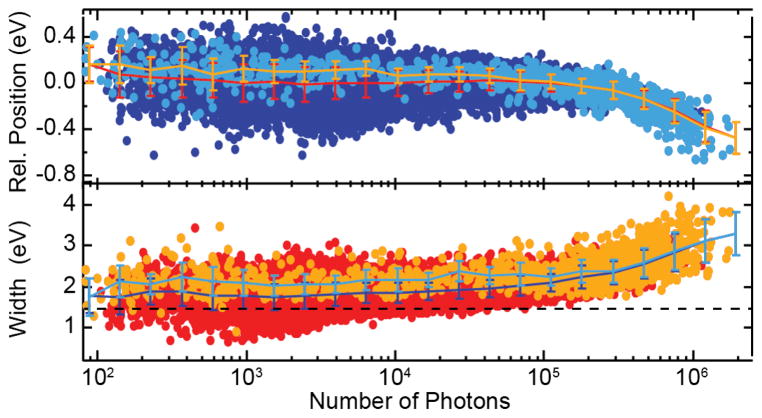
FIG. 2.
Relative position (top) and width (bottom) of the stimulated XES peak as a function of the number of detected photons in the emission line. The bright colors represent the selected shots given in yellow in Fig. 1(c). Both position and width are constant within error bars up to a peak intensity of ~2 × 10⁵ detected emission photons per shot, before they get broader and shift towards lower emission energies. The dashed line represents the natural lifetime broadening of 1.48 eV.

