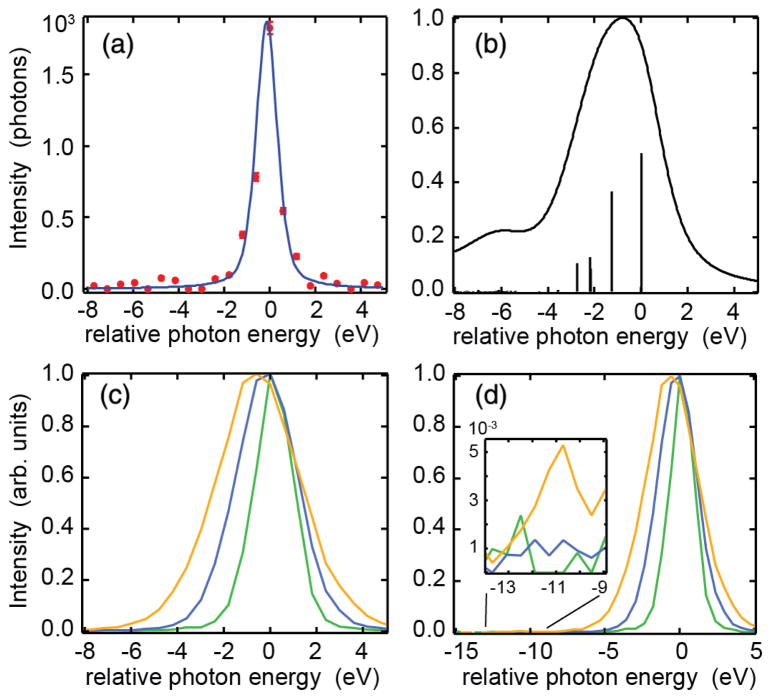
FIG. 3.
Line shapes of MnCl2 solution. (a) Single shot spectrum together with a pseudo-Voigt fit with FWHM = 0.8 eV (Gaussian) and 0.5 eV (Lorentzian). (b) Multiplet simulation of the MnCl2 Kα1 line, the vertical sticks represent the intensities at the corresponding final state energies. (c) Single shot spectra normalized to maximum with increasing intensity and increasing peak width FWHM = 2.0 (green), 3.1 (blue), and 4.2 eV (yellow), respectively. (d) The same as (c), but for a wider energy range that also includes the Kα2 region. The inset shows an enlargement to the Kα2 region with only the widest line carrying intensity.

