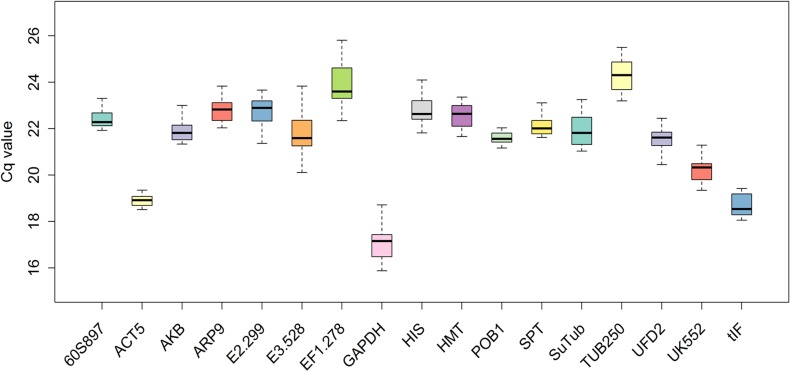
Fig 1. Distribution of the quantification cycle (Cq) values of the 17 candidate reference genes in Sanionia uncinata samples.
The median Cq values for 11 samples are displayed in a boxplot indicating the interquartile range. Error bars represent the minimum and maximum Cq values and the middle panes show the mean values. Three biological replicates per sample and four technical replicates per biological replicate were used.

