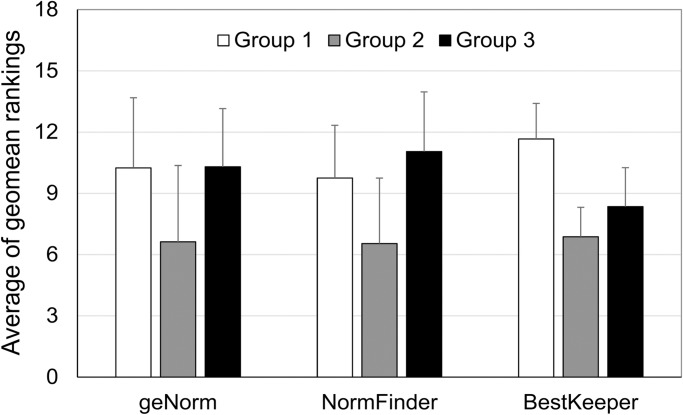
Fig 5. Distribution of average geomean rankings for candidate reference genes depending of the gene group.
Values were obtained by calculating an average comprehensive ranking for the genes in the gene group 1, 2, and 3, respectively. Four datasets from different experimental sets were used, and error bars represent standard deviation.

