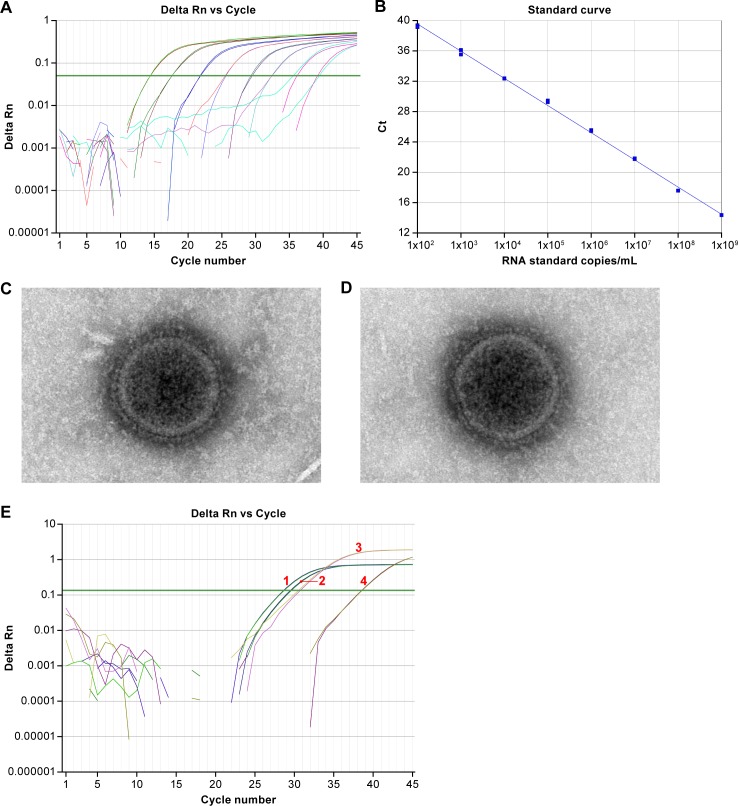
Fig 2. Amplification of T7 generated RNA synthetic transcripts.
(A) Amplification plot of synthetic RNA transcripts that serve as the RNA standard shows the variation of the log of ΔRn (change in normalized reporter from baseline) with the cycle number. The green line is the threshold line, and the cycle threshold (Ct) is the intersection of the amplification curve and the threshold line. The copy number of the RNA standard in 1-log10 dilutions ranges from 1 x 10² to 1 x 10⁹ copies/ml. (B) The standard curve has a slope of -3.58 and a r2 of 0.998. (C) Electron micrograph of Nipah virus Malaysia. (D) Electron micrograph of Nipah virus Bangladesh. (E) Detection of NiV-M mRNA transcripts. cDNA was generated from viral genomic RNA and mRNA transcripts using either a random nanomer or oligodT primer. qPCR was subsequently performed using primers/probe designed against the F-G intergenic region or a region within the N gene. Results demonstrate that the primers and probe designed against the N gene detected both genomic RNA (1) (average Ct value = 28.6) and mRNA transcripts (2) (average Ct value = 29.5), with mRNA transcripts significantly contributing to detectable total viral RNA levels. The primers and probe designed against the intergenic region detect the random nanomer cDNA at lower concentrations (3) (average Ct value = 30.6). Viral mRNA transcripts contribute an insignificant amount to measurable NiV-M RNA concentrations (4) (average Ct value = 38.5).

