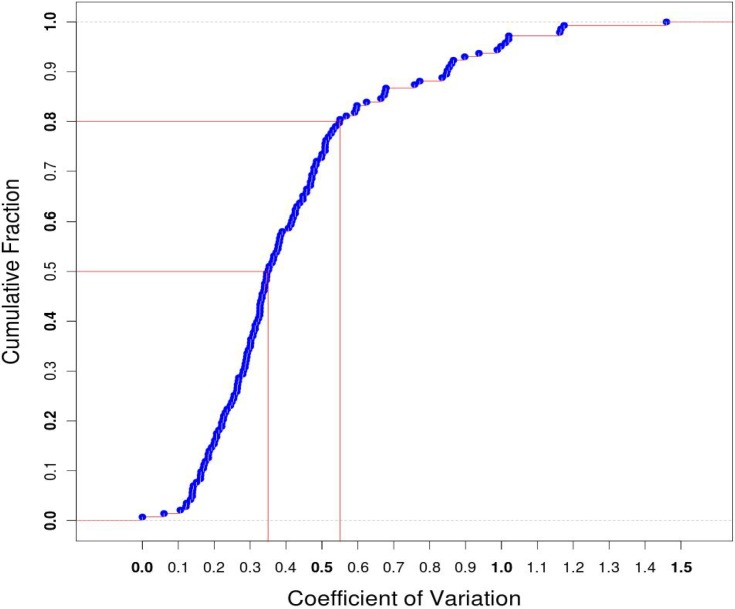
Fig 1. Distribution of coefficient of variation (CV) of the 143 reference HKGs.
The coefficient of variation was calculated for the expressions of each 143 reference HKGs in four SCT libraries and then plotted against their corresponding percentage. As shown in the figure, about 80% of the CVs were less than 0.55.

