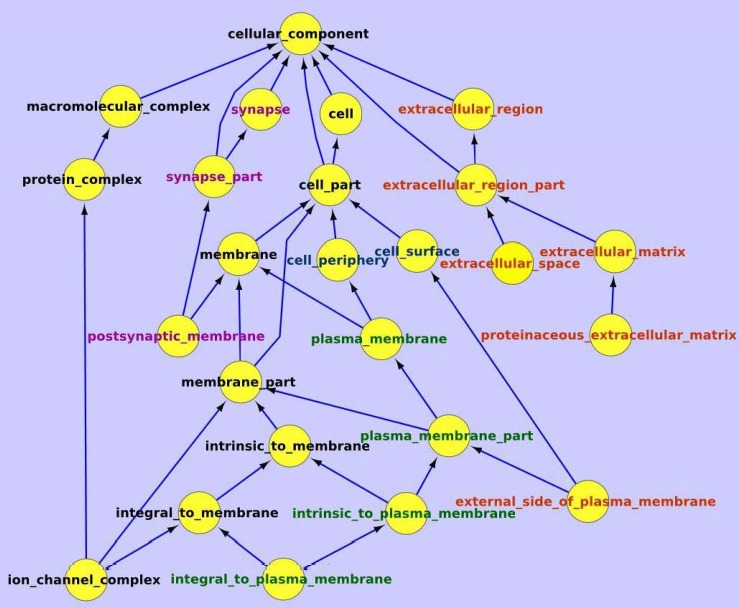
Fig 8. GO cellular component analysis for the inconsistently expressed (IE) genes.
Genes inconsistently expressed in the four single cell transcriptome libraries are analyzed using Gene Ontology cellular component database. Components associated with major terms are highlighted with color, e.g., ‘synapse’ in purple, ‘plasma membrane’ in green, and ‘extracellular or external’ in red.

