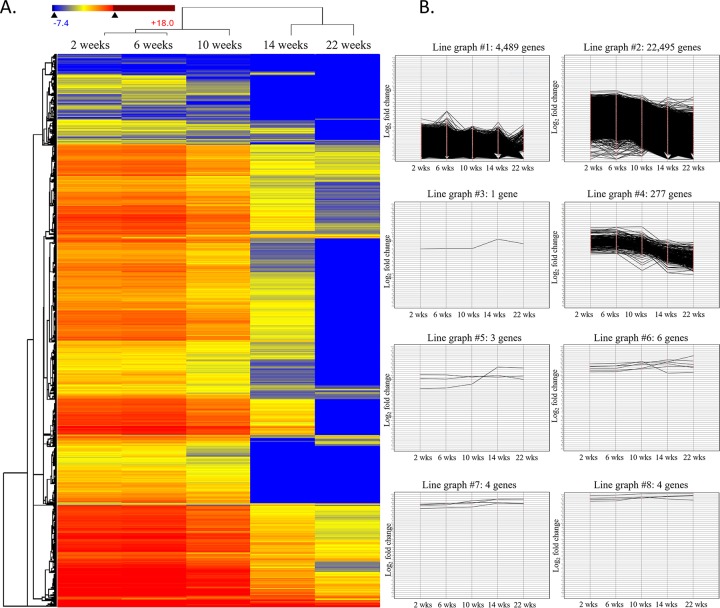
Fig 6.
A. A cluster heat map displaying the change of gene expression. Each column represented a different selection stage and the each low represented the level of transcription expressed in the color scheme. In total, 27,279 transcripts were compared across the selection process. The transcript levels observed at wk 2 were considered as the basal transcriptional level for comparison with gene expression levels observed at 6, 10, >14, and >22 wks. In general, transcripts were hierachically clustered, based on analysis using the Centroid method and Euclidean distance metric. B. The line graphs shows different gene expression patterns among the 27,279 transcripts, indicative of low phosphate selection. Among the 27,279 transcripts, >99.9% transcripts showed a gradual decrease in gene expression (line graph #1,#2, and #4), whereas, increased expression was observed for only <0.1% of transcripts (line graph #7 and #8).

