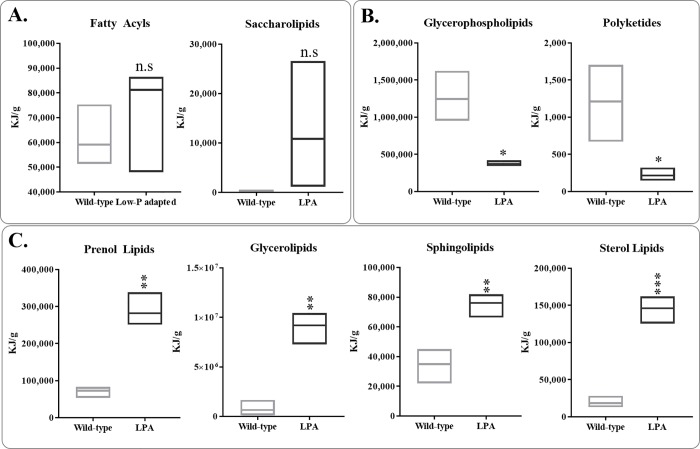
Fig 9. Lipid composition of wild-type and low P-adapted strain by LC-MS analysis.
A. Fatty acyls and saccharolipids were produced at similar levels by both strains (t-test, n = 3, P>0.05). B. Glycerophospholipid and polyketide accumulation was less in the low P-adapted compared to wild type strain (t-test, n = 3, P<0.05). C. Prenol lipids, glycerolipids, sphingolipids, and sterol lipids were increased in the low P-adapted strain (t-test, n = 3, P<0.05).

