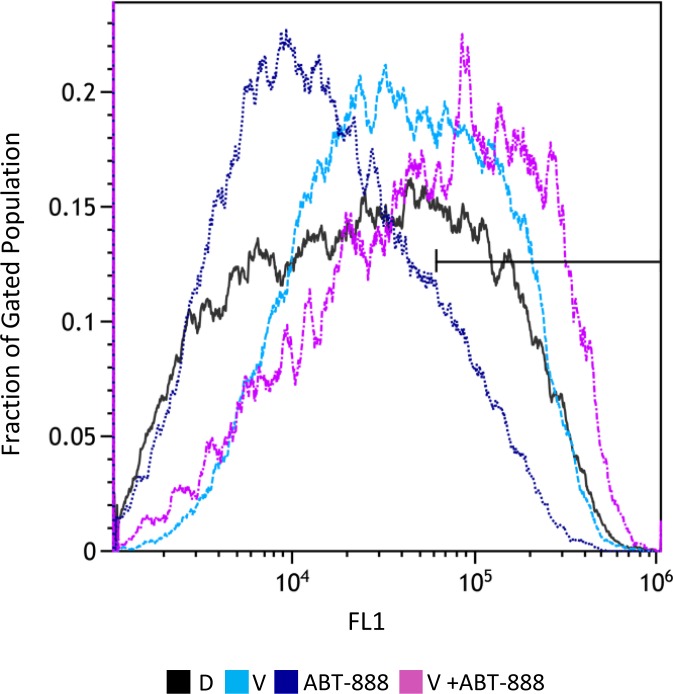
Figure 2. Combined treatment of vorinostat and ABT-888 increases cellular level of ROS: Cells were treated with 0.5 μM vorinostat (V), 10 μM ABT-888 or both.
Control untreated cells received DMSO (D). Seventy-two hours later, the cells were stained with CM-H2DCFDA and their ROS level was evaluated by flow-cytometry measurements of their fluorescent intensity as described in Methods. The bar indicates that the combination of vorinostat and ABT-888 increases the fraction of cells with the highest fluorescent intensity (X-MED ~6*104) relative to cells treated with vorinostat or to controls. Treatment with ABT-888 leads to decreased level of ROS in the cells relative to control untreated cells. X-Med values for control, ABT-888 and vorinostat were ~2.6*104, 1.3*104, and 3.9*104, respectively.

