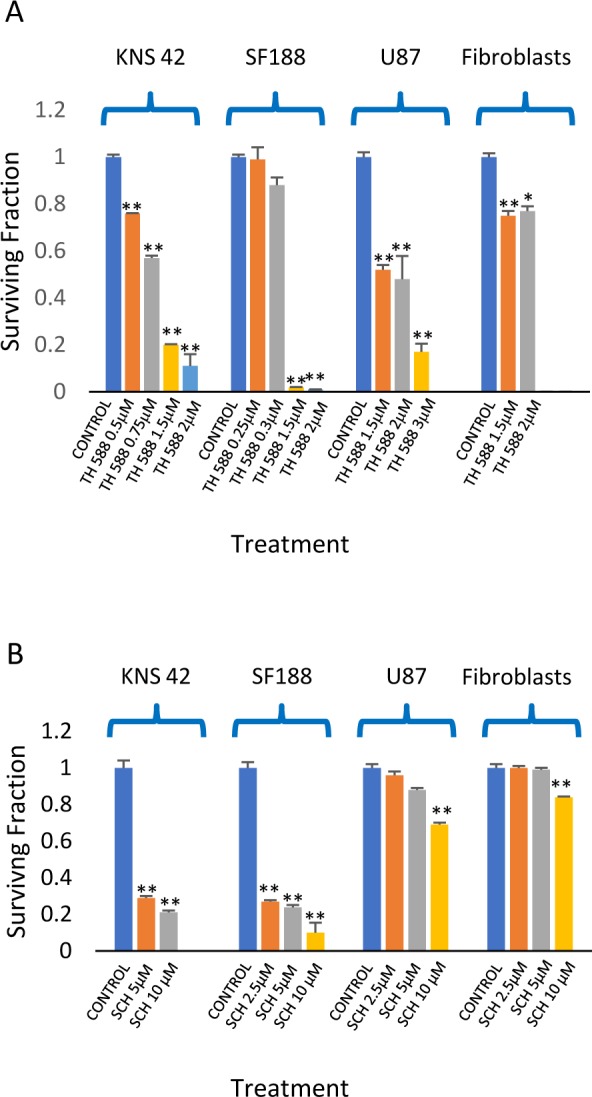
Figure 4. The effect of MTH1 inhibitors on the clonogenic survival of glioblastoma and fibroblasts: Colony survival assay was conducted as described in methods.

Values are mean of surviving fraction ± S.E.M of triplicates. (A) TH588. (B) SCH5134. The stars represent a significant difference between the surviving fractions of the treated cells and controls. *p<0.05, **p<0.005.
