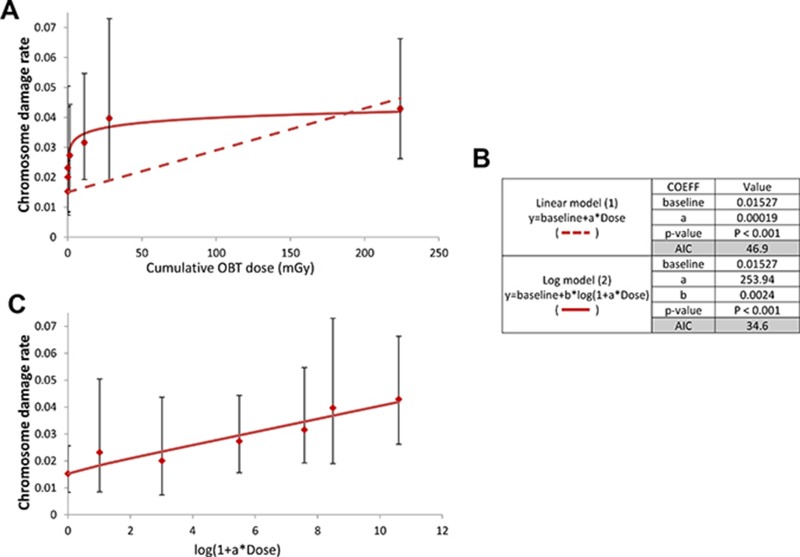
Figure 3. Dose-response for chromosome damages induced by in vivo chronic OBT exposure from both 1- and 8-month experiments.
(A) chromosome damage rates resulting from chronic OBT exposure were plotted as a function of OBT-cumulative dose. The dotted line represents the curve fitted using a linear model (1). The full line represents the curve fitted using a logarithmic model (2). Error bars represent the upper and lower 95% confidence intervals assuming Poisson distribution. (B) Table summarizing the coefficients, p-value and AIC associated with each model (C), dose-response for OBT-induced chromosome damage that illustrates dose-dependence. Chromosome damage rates were plotted as a function of OBT-cumulative dose rescaled according to the logarithmic term in the equation (2). Error bars represent the upper and lower 95% confidence intervals assuming Poisson distribution.

