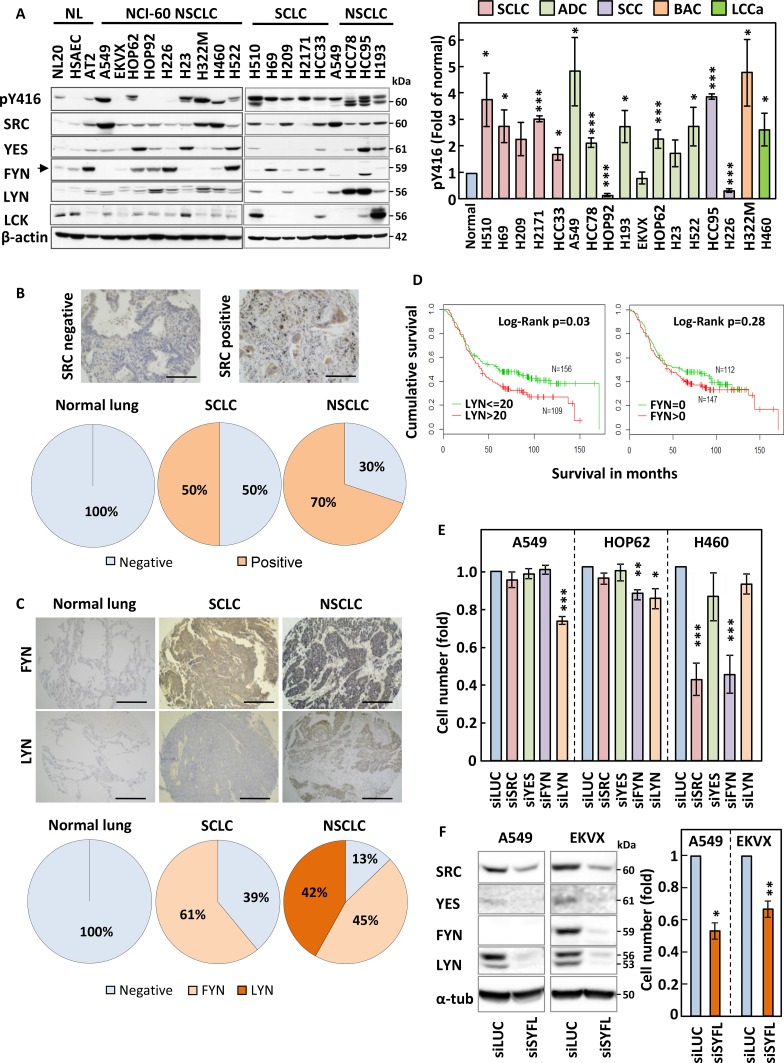
Figure 1. SRC family members are overexpressed in lung cancer.
(A) Expression and tyrosine phosphorylation (Y416) of SRC family kinases (SFKs) in small-cell (SCLC) and non-small cell lung cancer (NSCLC) cell lines as compared to normal lung epithelial cells. Cell protein extracts were analysed by SDS-PAGE/Western blotting for the indicated proteins. Detection of β-actin served as loading control. NL; normal lung immortalised cell lines, NCI-60; cell lines part of the National Cancer Institute panel. (A-right panel) The phosphorylation of SFKs at Y416 was quantified by optical densitometry, normalised to actin levels and represented as fold of levels found in AT2 cells. The data represent the average of three independent experiments ± SEM. (B and C) Lung cancer and normal lung specimen (N = 469 and 61, respectively) were stained either for SRC (B) or for FYN and LYN (C). Representative staining results are pictured in the upper panel and quantification of the proportion of stained specimen is shown in the lower panels. (D) Kaplan-Meier survival curve for patients with LYN≤20 and those with LYN>20 (left) and patients with FYN = 0 and those FYN >0 (right). N = 284. (E) A549, HOP62 and H460 were transfected with pools of 4 siRNA sequences targeting the expression of SRC, YES, FYN or LYN and the effects of this on cell growth was monitored by crystal violet staining. Silencing of Luciferase (siLUC) was used as a negative control. (F) A549 and EKVX cells were transfected with siRNA pools targeting SRC, YES, FYN and LYN together (siSYFL). Left panel; cell lysates were analysed by SDS-PAGE/Western blotting for the indicated proteins. Right panel; cell growth was monitored by crystal violet staining. (E and F) Results shown are averagre of three independent experiements performed in quadruplicate ± SEM. Statistical analysis: (A-right panel) Student's t-test with Welch correction, (E and F) ANOVA (*p < 0.05, **p < 0.01, ***p < 0.005).

