
Fig. 3. Mechanism of lipid recognition.
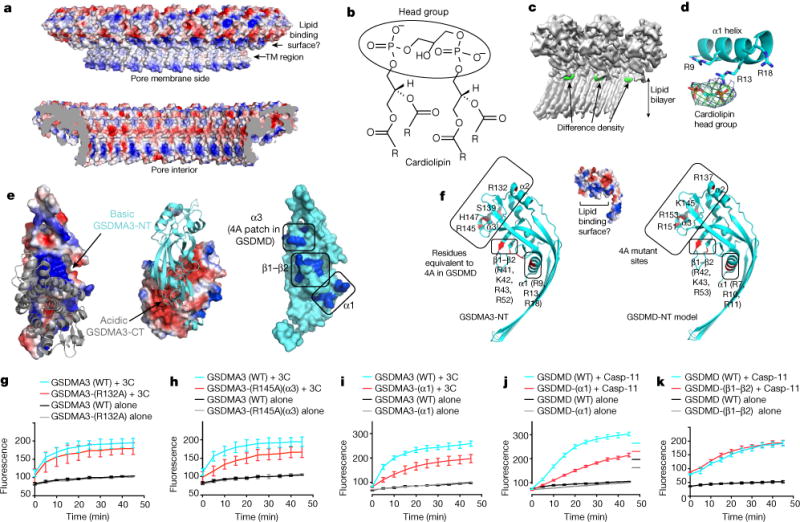
a, Charge distribution in the GSDMA3 pore, viewed from the membrane side (top) and the pore interior (bottom). TM, transmembrane. b, Chemical structure of cardiolipin showing two phosphatidic acid moieties in the head group. The four R groups represent C17H33. c, Cryo-EM map of the GSDMA3 pore (grey) with the difference density map for potential bound lipid (green). d, Cardiolipin head group fitted into the lipid density in proximity to basic residues in the α1 helix. e, Potential lipid-binding patch. Left and middle, the auto-inhibited GSDMA3 structure1, shown in electrostatic surface for the N-terminal domain and grey ribbon for the C-terminal domain (left), and in cyan ribbon for the N-terminal domain and electrostatic surface for the C-terminal domain (middle). Right, the N-terminal domain in its auto-inhibited form shown as a surface diagram with the positively charged patches in blue. f, The basic patch in the pore form contains residues from helices α1 and α3 and the β1–β2 region. Relevant residues are labelled for GSDMA3-NT (left) and for a model of human GSDMD-NT (right). g–k, Effects of GSDMA3 (g–i) and GSDMD (j, k) mutations on liposome-leakage activities, monitored by measuring dipicolinic acid (DPA)-chelating-induced fluorescence of released Tb3+ ion (n = 3 biological replicates). Error bars denote mean ± s.d.