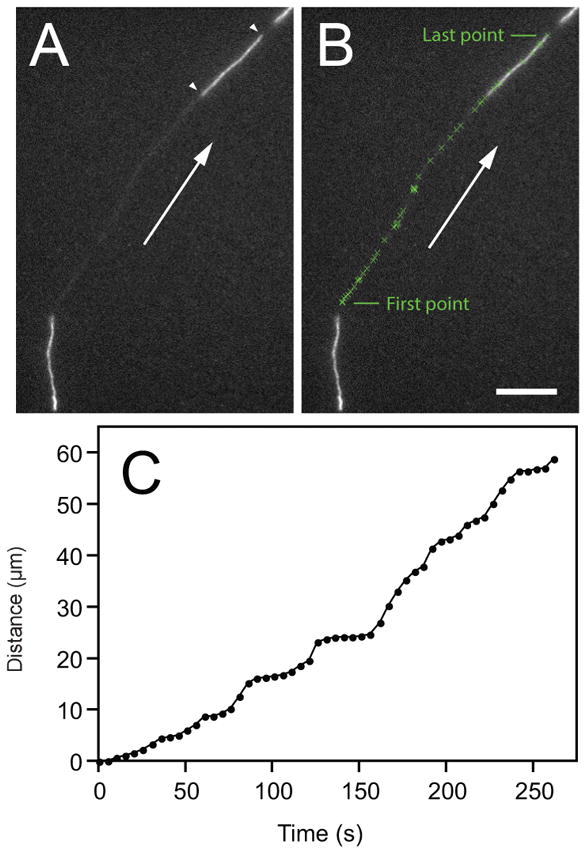
Fig. 16.

Manual tracking of a neurofilament that moved through a gap in the axonal neurofilament array. Cultured mouse cortical neuron expressing GFP-NFM. Time-lapse imaging at 5 second intervals. The leading end of the neurofilament was tracked through 53 image planes using the TrackPoints function in the Motion drop-in the MetaMorph™ software. A. Image of the neurofilament in the last plane of the movie, just before the filament exited the gap. The white arrowheads mark the leading and trailing ends of the filament and the white arrow shows the direction of movement. B. The tracked positions of the leading end of the filament in each image plane superimposed on the same image (tracked points marked with a green “x”). Scale bar= 10 μm. C. Graph of the distance moved along the axon versus time for all 53 image planes.
