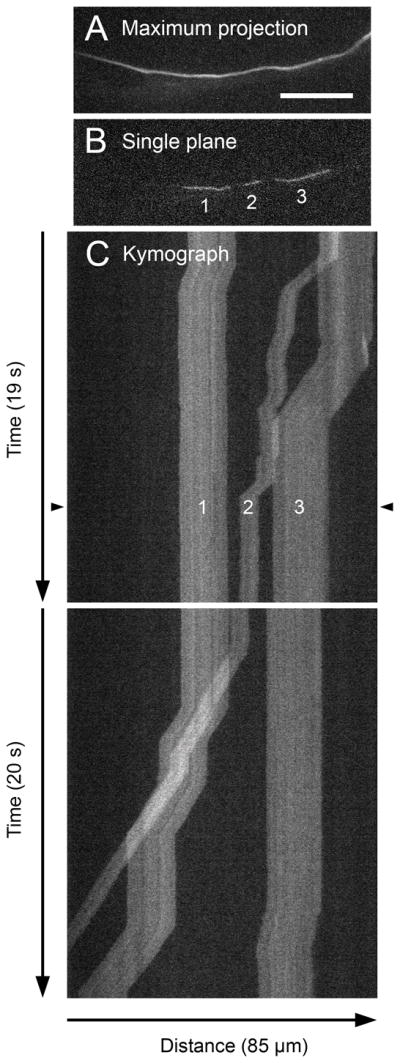
Fig. 18.

Kymograph analysis of neurofilament transport. Rat cortical neuron culture transfected with GFP-NFM and imaged by streaming acquisition with 30 millisecond exposures (~33 frames per second) using an Andor Ultra 897 EMCCD camera. The acquisition period was 450 seconds (15,000 frames). A. Maximum projection of the movie planes, revealing the path of the moving filaments along the axon. B. A single plane from the movie, corresponding to the time point marked by the black arrowheads in C in the kymograph below. Note the three filaments whose trajectories can be traced in the kymograph. C. Two portions of the corresponding kymograph. The horizontal dimension represents distance along the axon and the vertical dimension represents time. Each row of pixels in the kymograph represents a linear intensity profile along the axon path (defined by the maximum projection in A) in one plane of the movie. The kymograph is wider than the images in A and B because the axon traces a curved path. The temporal resolution is sufficient to resolve the single processive bouts of the moving filaments (diagonal streaks) separated by pauses (vertical streaks). The slope of the diagonal streaks yields the velocity. The three filaments shown here all move retrogradely. Note the non-uniform incorporation of GFP-NFM along the filaments, which gives their trajectories a “barcode” appearance. Scale bar = 20 μm.
