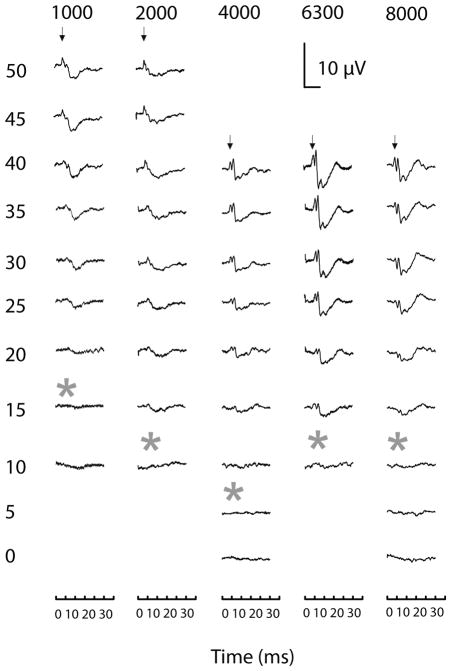
Fig. 6.
Raw ABR traces, averaged with 300 repetitions, from adult owls from increasing to decreasing intensity. The recording started at the onset of stimulus. All of the traces were from owls at least a year old (n = 2), except for the 8 kHz tone (P70). Asterisks represent threshold, which was 2.5 dB SPL below the last waveform that showed a peak. Stimulus levels are shown on the y-axis (dBA). Arrows indicate peak I.

