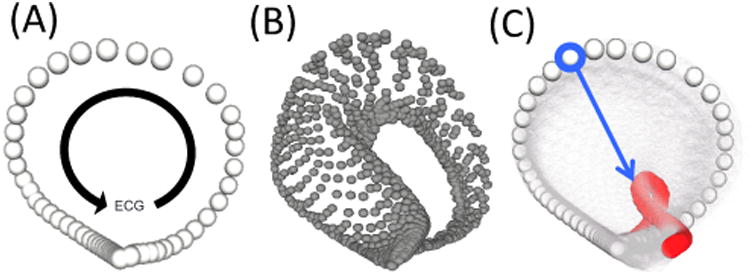
Figure 1.

Laplacian Eigenmap manifolds. A.) This manifold consists of a single trajectory corresponding to a run during the rest period, before the induction of ischemia. The progression of the ECG and its relation to the trajectory are shown by the black arrow. B.) This manifold shows several runs mapped into the same manifold space. Each trajectory corresponds to a single run during the intervention. C.) This final manifold shows the trajectory of the run taken at rest (white) and the final run of the intervention (red) with all other trajectories set to be transparent. The blue arrow corresponded to the point on the trajectory that showed the greatest sensitivity to the underlying ischemic stress.
