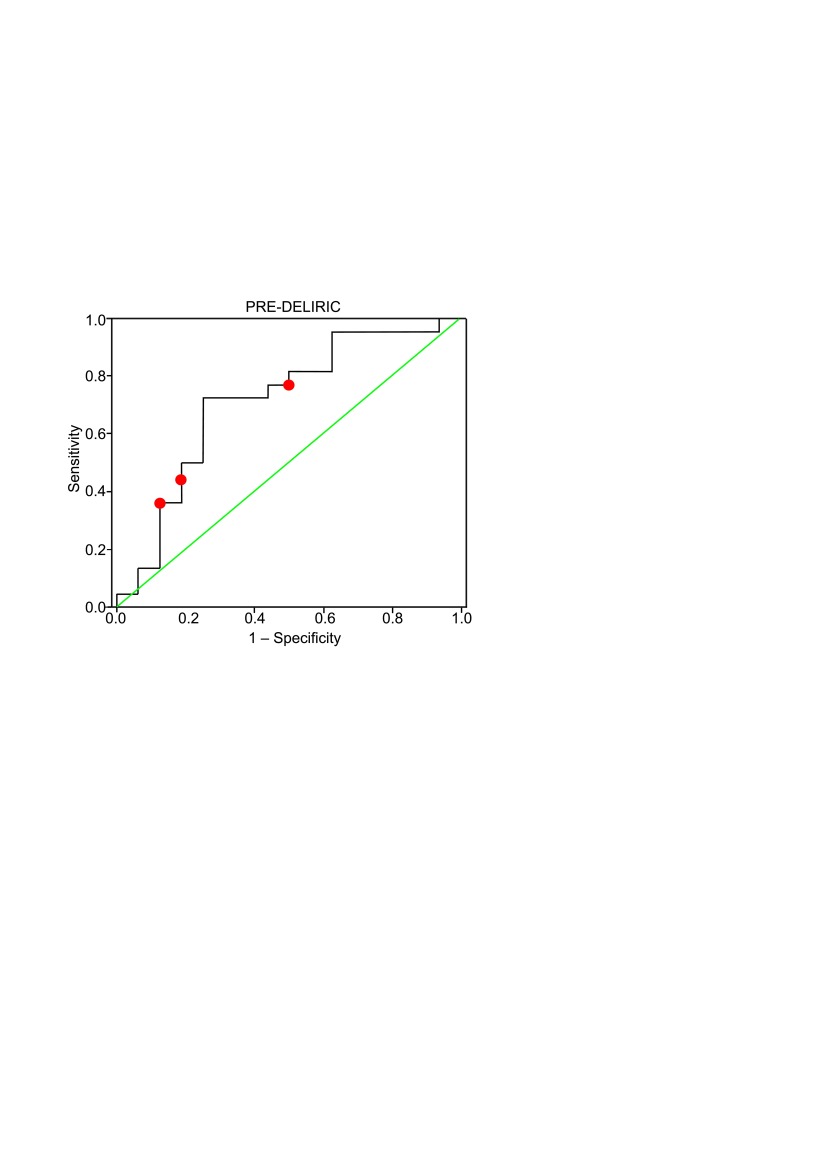
Fig. 3.
The ROC curve for the PRE-DELIRIC model (curved line). The relationship between true-positive (sensitivity) and false-positive (1 – specificity). The diagonal line is the line of chance performance. The area under the curve is 0.713 (p < 0.05, 95% CI 0.539–0.887). Red dots represent the cut-off values of 20%, 40% and 50%

