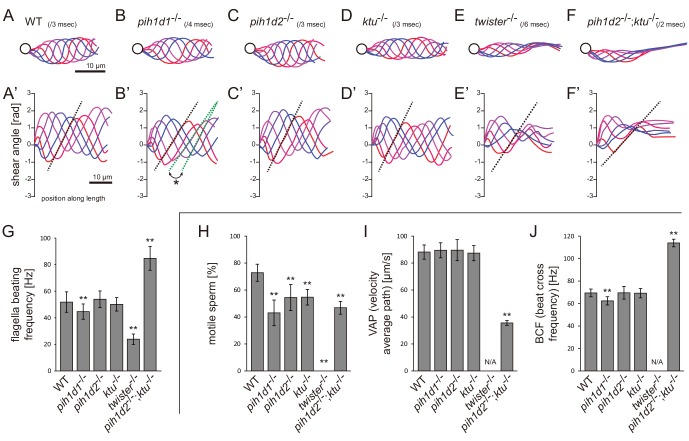
Figure 2. Mutations of PIH genes caused abnormal sperm motilities.
(A–G) Waveforms and the beating frequencies of motile sperms were analyzed using a high-speed camera at 1000 fps (frames per second). (A–F) Sperm waveforms were traced six times in one beating cycle and overlaid. Intervals are as follows: WT, 3 ms; pih1d1-/-, 4 ms; pih1d2-/-, 3 ms; ktu-/-, 3 ms; twister-/-, 6 ms; and pih1d2-/-;ktu-/-, 2 ms. Traces are painted in a color gradient of from red (first traces) to blue (sixth traces). (A’–F’) Shear angles of beating flagella were calculated from each trace of A-F. Slopes of dotted lines represent the size of flagellar bending. An asterisk with green dotted lines in B’ shows unstable propagation of flagellar bending in pih1d1-/- sperm. (G) Beating frequencies of sperm flagella were measured by sperm kymographs. Kymographs of pih1d2-/-;ktu-/- were obtained from the proximal region of sperm flagella, as distal flagella were immotile. Number of samples: WT, 23; pih1d1-/-, 23; pih1d2-/-, 26; ktu-/-, 15; twister-/-, 8; and pih1d2-/-;ktu-/-, 14. (H–J) Motilities of free-swimming spermatozoa were observed using a high-speed camera at 200 fps and analyzed by CASA modified for zebrafish. For each zebrafish line, more than 1200 spermatozoa were observed in total with sixteen technical replicates. Spermatozoa with less than 20 μm/s velocities were considered immotile. (H) Ratio of motile (locomotive) sperm. (I) Velocity of spermatozoa on averaged paths. Averaged paths were constructed by connecting the points of averaged sperm positions of coordinating 33 frames. (J) Frequencies at which sperm heads crossed their averaged paths. Bar graphs show mean ±SD. **: p-value<0.01 in Dunnett's test of each mutant against WT.


