. 2018 May 9;7:e36979. doi: 10.7554/eLife.36979

Figure 4. Immunoblot and immunofluorescence microscopy of axonemal dyneins.

(A) Immunoblot of sperm axonemes. Asterisks, filled circles, and open circles indicate missing, decreased, and shifted bands, respectively. Acetylated tubulin: control. (B) Immunofluorescence microscopy of zebrafish spermatozoa. Dnah8 was localized along the entire length of sperm flagella in WT, pih1d1-/-, pih1d2-/-, ktu-/-. In twister-/-, Dnah8 was lost (white asterisk), while in pih1d2-/-;ktu-/-, Dnah8 was localized only in the proximal half of the flagella (white arrowhead).

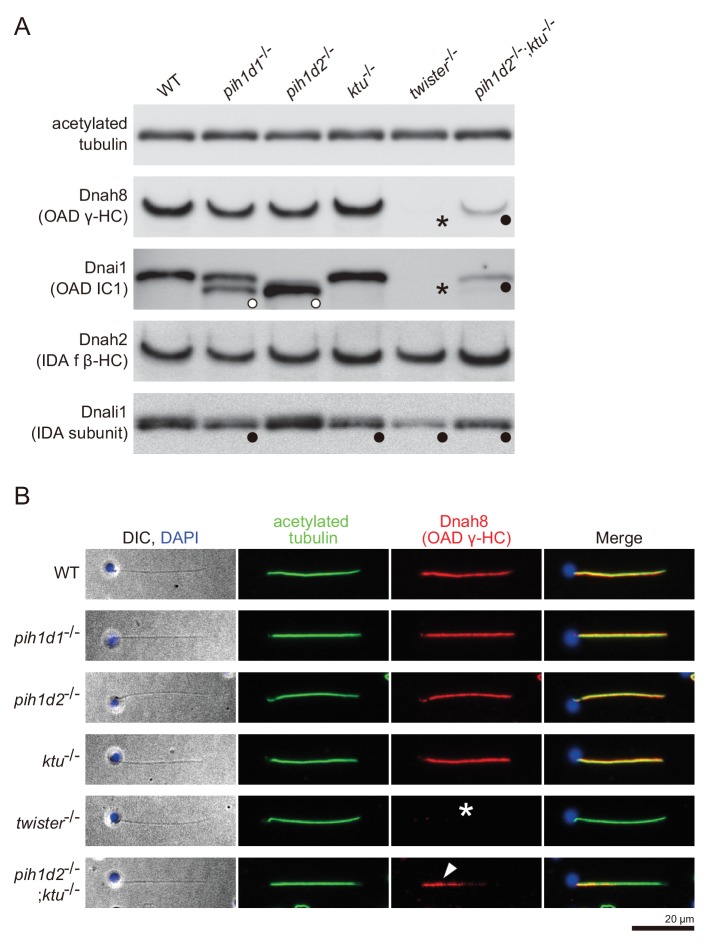
Figure 4.

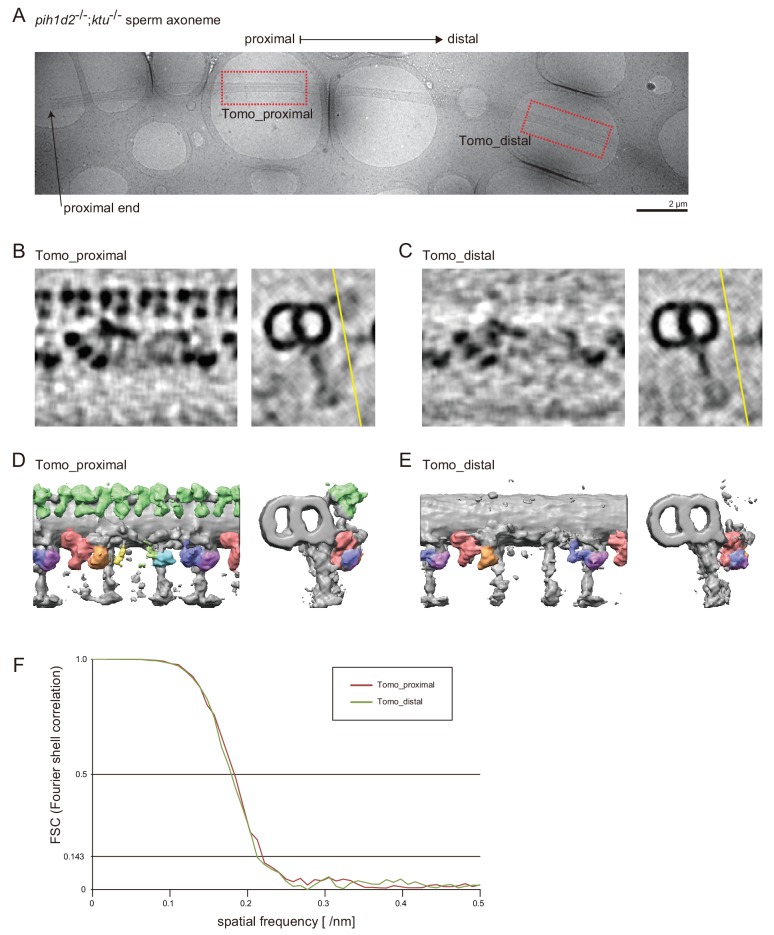
Figure 4—figure supplement 1. Axonemal structures in pih1d2-/-;ktu-/- sperm.

Figure 4—figure supplement 1.

(A) Cryo-TEM image of pih1d2-/-;ktu-/- axoneme, which was suitable for observing both proximal and distal regions by cryo-ET. Red squares indicate the observed areas. (B and C) 5-nm-thick slices of the subtomograms of the proximal (B; Tomo_proximal) and the distal (C; Tomo_distal) regions. Images on the left show slices of subtomograms at the point indicated by the yellow lines in the images on the right (cross-section). (D and E) 3D images of averaged subtomograms. Left: side views. Right: cross views. (F) Fourier shell correlation curves of the averaged subtomograms in this study. Number of particles: Tomo_proximal, 128; and Tomo_distal, 115. Effective resolutions were determined by a cutoff value of 0.143, and approximately 46 Å was estimated.