Figure 1. Protein turnover in neurons.
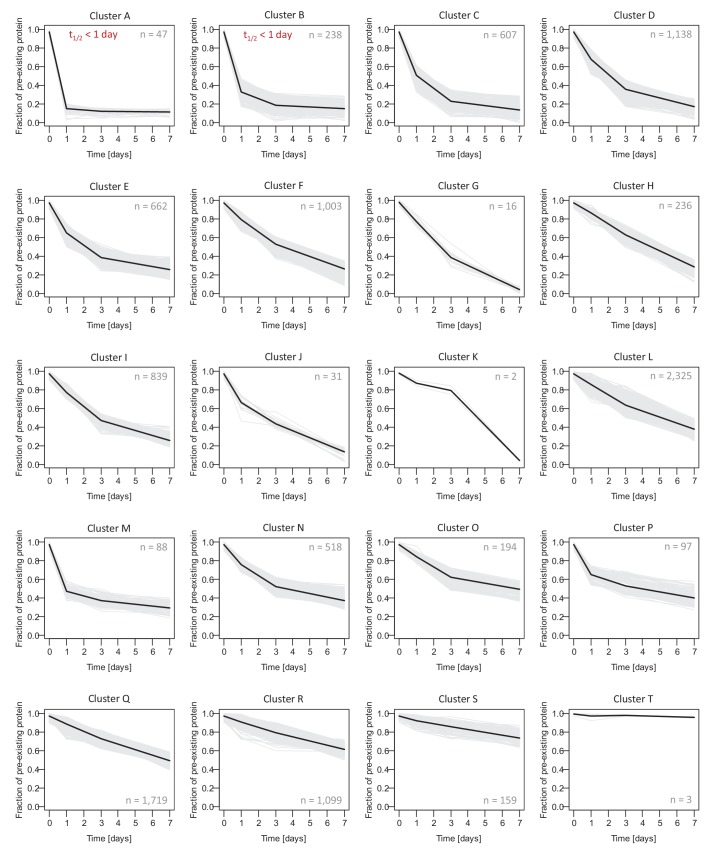
(A) Protein half-lives were determined by a dynamic SILAC approach in combination with MS. Cells were grown for 18–19 days in medium containing natural amino acids (‘light’) and then switched to a medium containing heavy isotopically labelled arginine (R10) and lysine (K8). Upon the medium change, the ‘heavy’ amino acids were incorporated into newly synthesized proteins, whereas the fraction of ‘light’ pre-existing proteins decayed over time. The cells were harvested 1, 3 and 7 days after the medium change as well as just before the medium change (t0) and the fractions of newly synthesized proteins and pre-existing proteins were determined by MS. Protein half-lives were determined based on first order exponential fitting of the fraction of pre-existing proteins over time. (B) Distribution of protein half-lives in primary hippocampal cultures ranged from <1 day to >20 days.
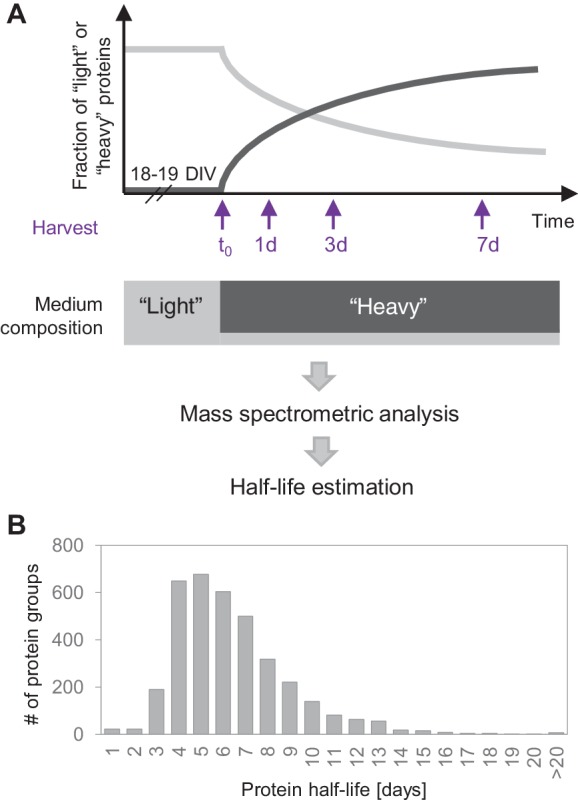
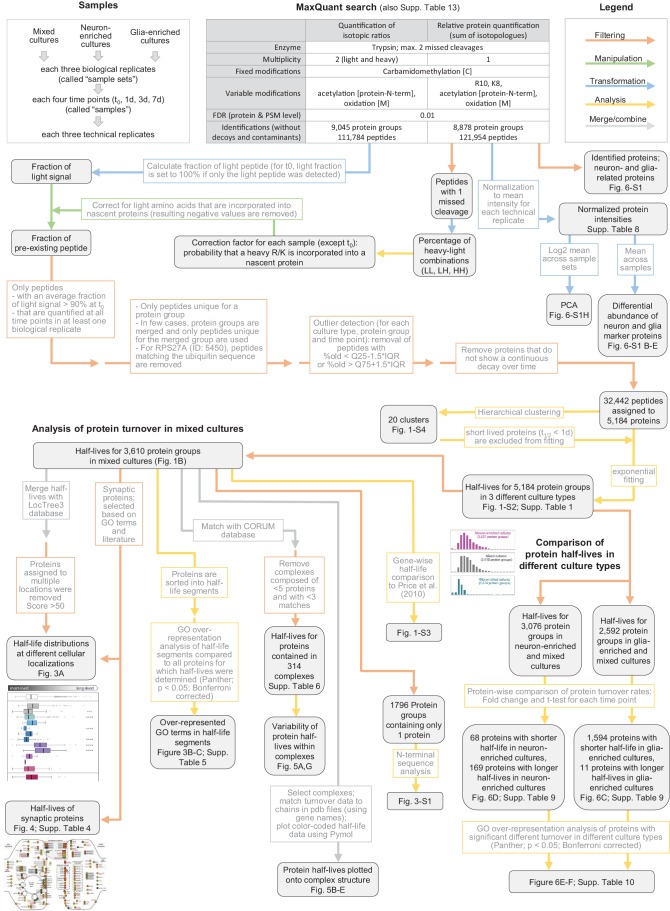
Figure 1—figure supplement 1. Data processing workflow of dynamic SILAC samples.
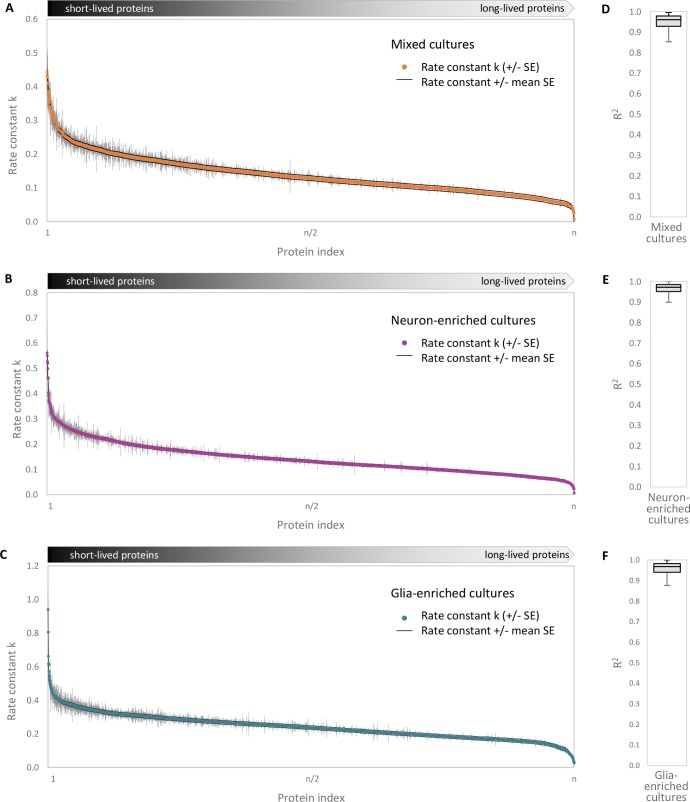
Figure 1—figure supplement 2. Accuracy of turnover estimation.
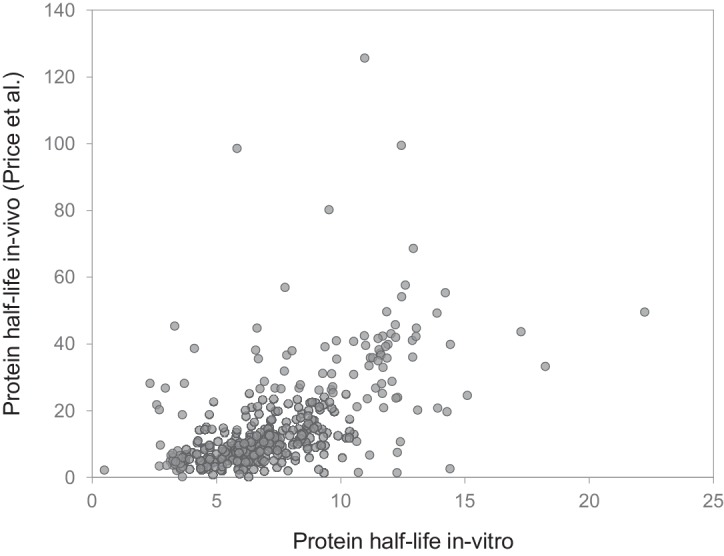
Figure 1—figure supplement 3. Comparison to in vivo study.
