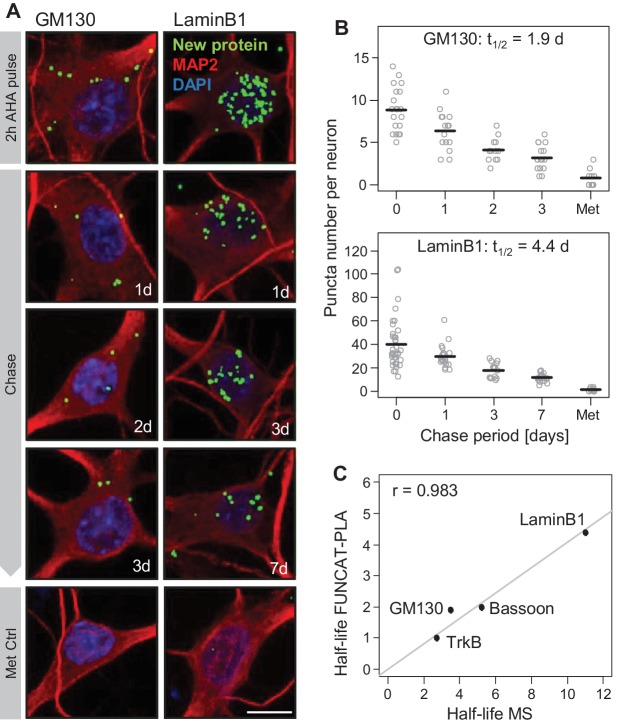
Figure 2. Validation of mass spectrometry results with metabolic labeling and visualization.
Protein half-lives were determined by FUNCAT-PLA for GM130 and LaminB1. Degradation of newly synthesized proteins (following a 2 hr AHA pulse) was monitored for 0 (no chase), 1, 2 and 3 days for GM130 and for 0, 1, 3 and 7 days for LaminB1. (A) Representative images of neurons with newly synthesized LaminB1 and GM130 as indicated (green), cell body and dendrites (MAP2, red), nuclei (DAPI, blue). Puncta were dilated for visualization purposes only. Scale bar = 10 μm. (B) Group analysis of experiments shown in A. Puncta number per neuron is shown for individual cells (grey dots) as well as the mean (black line). Protein half-life was determined based on exponential fitting of the mean puncta number per cell. (C) Protein half-lives measured by FUNCAT-PLA and MS exhibit a high and significant correlation (Pearson correlation (r) = 0.983); data for TrkB and Bassoon were obtained from tom Dieck et al., 2015.

