Figure 3. Half-lives of proteins with different cellular locations and functions.
(A) Half-life distribution of proteins in different cellular compartments (LocTree annotation; score ≥50) and of synaptic proteins (extracted based on UniProt GO annotation). Number of protein groups assigned to each compartment is given in brackets. Mitochondrial proteins are significantly longer-lived compared to the complete set of quantified half-lives. Except in mitochondria, membrane proteins tend to be shorter-lived compared to soluble proteins in each compartment. Selected GO terms for cellular component (B) as well as biological process, molecular function and Panther protein class (C) that are over-represented (p-value<0.05) in distinct half-life segments. The complete set of over-represented GO terms and the full name of abbreviated GO terms (marked with *) are given in Figure 3—source data 2.

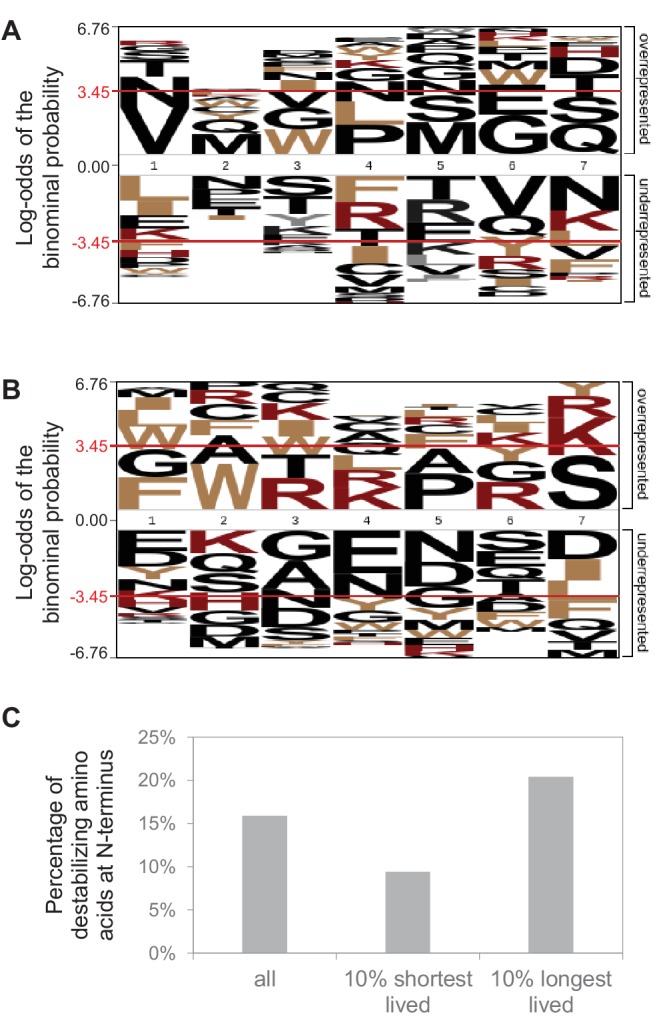
Figure 3—figure supplement 1. N-terminal sequence analysis.