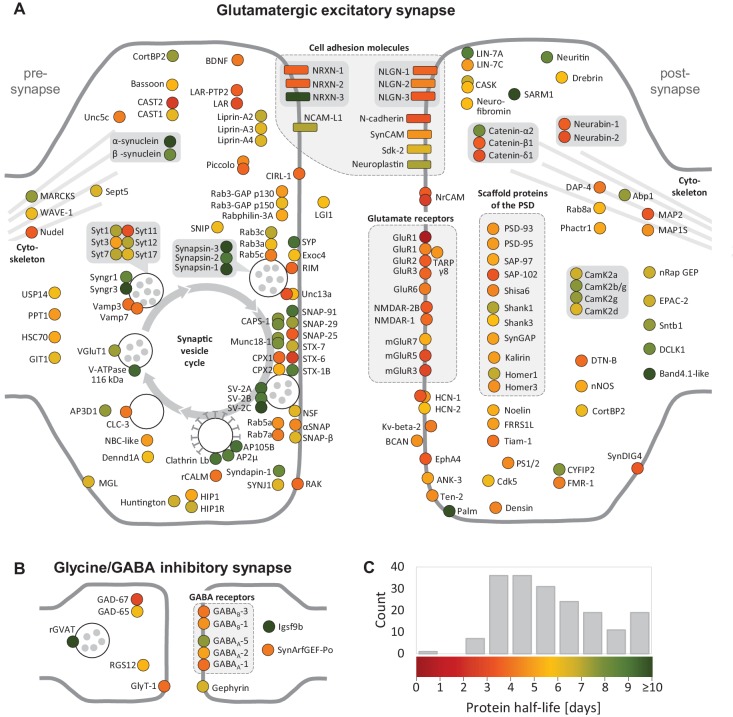
Figure 4. Half-lives of synaptic proteins.
Proteins located at glutamatergic synapses (A) and glycinergic or GABAergic synapses (B). Half-lives are indicated by a color code from red (short-lived) to green (long-lived). Multiple circles for the same protein name show different isoforms. Interacting proteins are displayed in closer proximity. Proteins with similar functions are grouped together and the synaptic vesicle cycle is indicated by arrows. Abbreviated protein names are explained in Figure 4—source data 1.

