Figure 5. Protein half-lives within multi-protein complexes.
(A) Standard deviation (SD) for half-lives within multi-protein complexes compared to SD between randomly sampled proteins. (B) Structures of the spliceosome (PDB code: 5O9Z), (C) the ribosome (PDB code: 3J7R), (D) the nuclear pore complex (multiple PDB codes, see Materials and methods) and (E) the ATP-synthase (PDB code: 5LQX) are color-coded according to the protein half-lives. For the nuclear pore complex (D) only one repeating unit is displayed. The whole complex is shown as an insert (bottom right). RNA molecules and proteins for which no half-life was determined are shown in grey. (F) Half-life distributions of the complex constituents and the corresponding color scales. (G) Relationship between the SD of complex members and complex assembly and disassembly dynamics. Average half-lives of complex members are indicated by the indicated color scale.

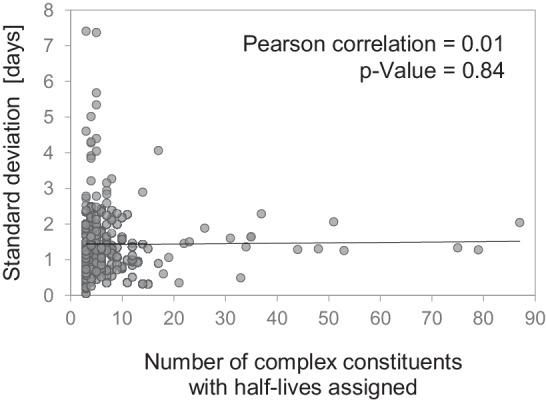
Figure 5—figure supplement 1. Correlation of half-life variability within protein complexes and complex size.