. 2018 Jun 19;7:e34202. doi: 10.7554/eLife.34202

Figure 6. Protein turnover rates of different cell types in different cellular environments.

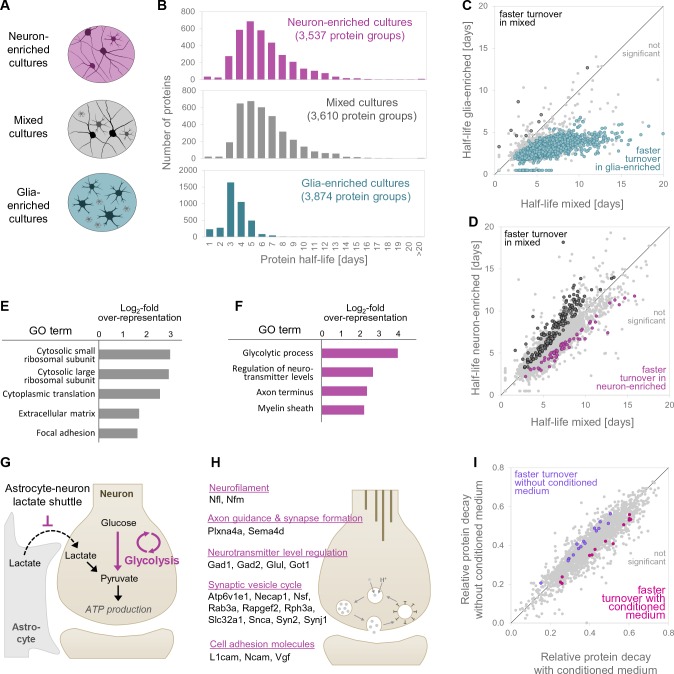
(A) Different cell culture types and environments for which protein turnover was investigated. (B) Protein half-life distributions for different primary neuronal culture types (mixed, neuron-enriched and glia-enriched cultures). (C and D) show protein-wise half-life comparisons for proteins in glia-enriched versus mixed cultures as well as neuron-enriched versus mixed cultures. Proteins with significantly regulated turnover rates (p<0.05 at≥2 of 3 time points, Bonferroni corrected) are highlighted in color. (E) GO over-representation analysis of proteins with significantly faster turnover rates in mixed cultures compared to neuron-enriched cultures. Selected over-represented GO terms (p<0.05) and their log2-fold over-representation are shown. (F) Same as E for proteins with significantly faster turnover rates in neuron-enriched cultures compared to mixed cultures. (G) Proposed mechanism to explain the increased turnover of glycolytic enzymes in neuron-enriched cultures. In the absence of glia cells, neurons are not supplied with lactate via the astrocyte-neuron-lactate-shuttle and hence pyruvate production relies on glycolysis exclusively. Glycolytic enzymes might be used more frequently, damaged more frequently and replaced earlier. (H) Selected proteins with significantly faster turnover rates in neuron-enriched cultures that are involved in synaptic processes. (I) Protein-wise turnover comparisons for proteins from neuron-enriched cultures maintained with or without conditioned medium. Proteins with significantly regulated turnover rates (p<0.05, Bonferroni corrected) are highlighted in color.

Figure 6—source data 1. Relative protein abundances in different culture types.
DOI: 10.7554/eLife.34202.025
Figure 6—source data 2. Protein half-life comparison between different culture types.
elife-34202-fig6-data2.xlsx (444.2KB, xlsx)
DOI: 10.7554/eLife.34202.026
Figure 6—source data 3. GO analysis of proteins with different turnover rates in mixed and neuron-enriched cultures.
DOI: 10.7554/eLife.34202.027
Figure 6—source data 4. Proteins with different turnover rates in neuron-enriched cultures with and without conditioned medium.
DOI: 10.7554/eLife.34202.028

Figure 6.

Figure 6—figure supplement 1. Comparison of different culture types.

Figure 6—figure supplement 1.

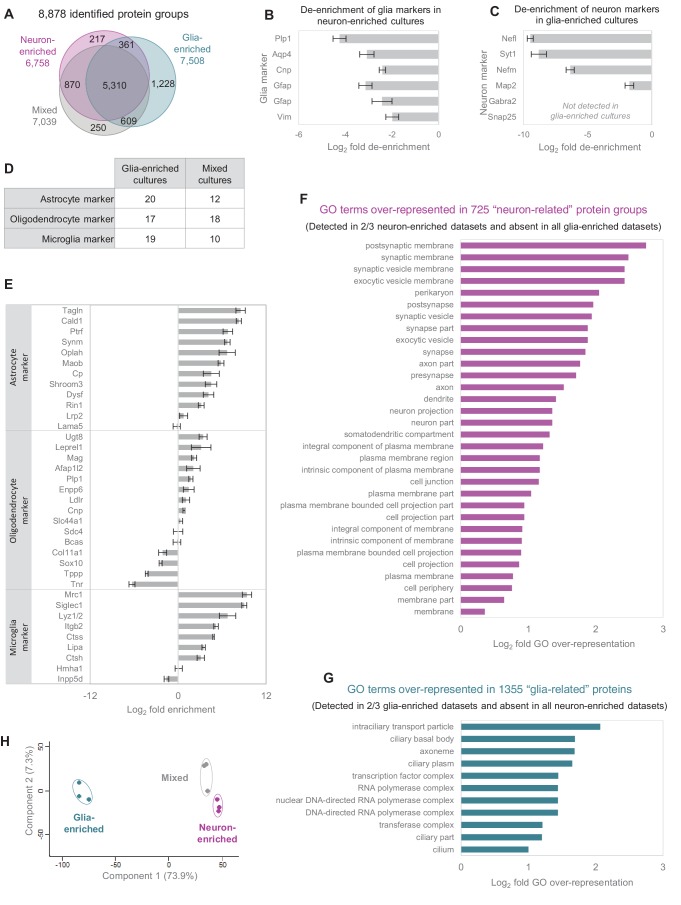
(A) Number of identified protein groups in the different culture types. (B) Established glia markers are de-enriched in neuron-enriched cultures. Bar diagram shows log2 fold change between neuron-enriched cultures and mixed cultures and error bars indicate SEM. (C) Established neuron markers are de-enriched in glia-enriched cultures. Bar diagram shows log2 fold change between glia-enriched cultures and mixed cultures and error bars indicate SEM. (D) Number of quantified astrocyte, oligodendrocyte and microglia marker proteins in glia-enriched versus mixed cultures. (E) Comparison of relative protein expression levels of astrocyte, oligodendrocyte and microglia markers in glia-enriched cultures versus mixed cultures. Error bars show the standard deviation. (F) GO over-representation analysis for 725 ‘neuron-related’ protein groups (detected in ≥2 biological replicates in neuron-enriched cultures and never detected in glia-enriched cultures). (G) GO over-representation analysis for 1,355 ‘glia-related’ protein groups (detected in ≥2 biological replicates in glia-enriched cultures and never detected in neuron-enriched cultures). (H) Different culture types form distinct clusters in a principle component analysis (PCA). For PCA, log2 transformed relative abundances of 3214 protein groups, which were detected in all biological replicates of all culture types, were used.
Figure 6—figure supplement 2. Faster protein turnover of glycolytic enzymes in neuron-enriched cultures.
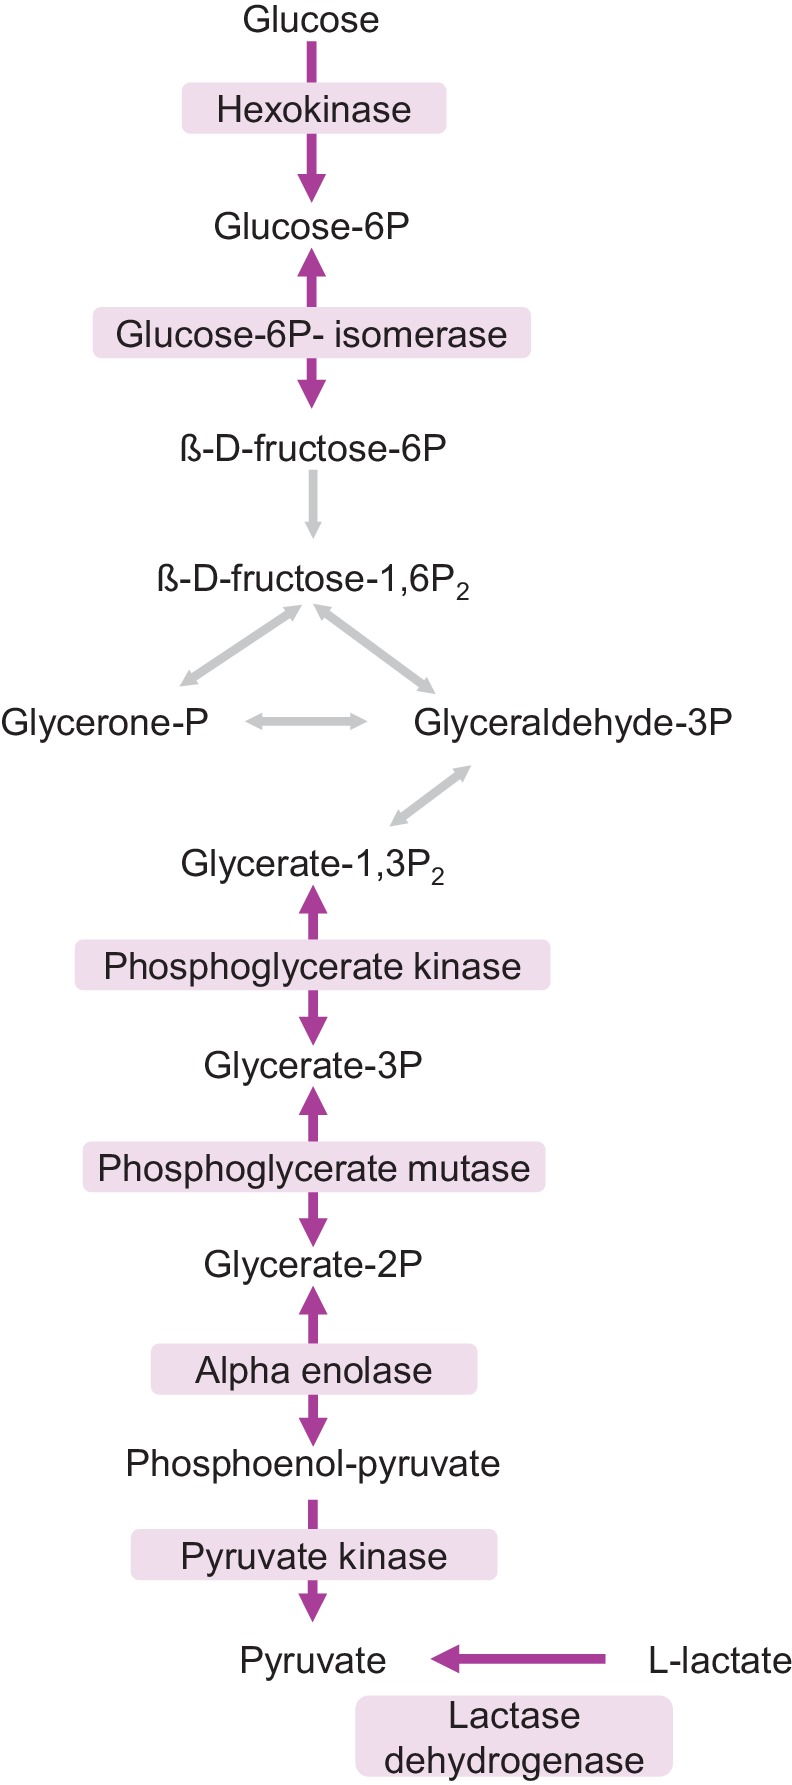
Figure 6—figure supplement 2.

Glycolysis pathway. Proteins with faster turnover in neuron-enriched cultures compared to mixed cultures are highlighted in purple.
Figure 6—figure supplement 3. Comparison of neuron-enriched cultures with and without conditioned medium.

Figure 6—figure supplement 3.

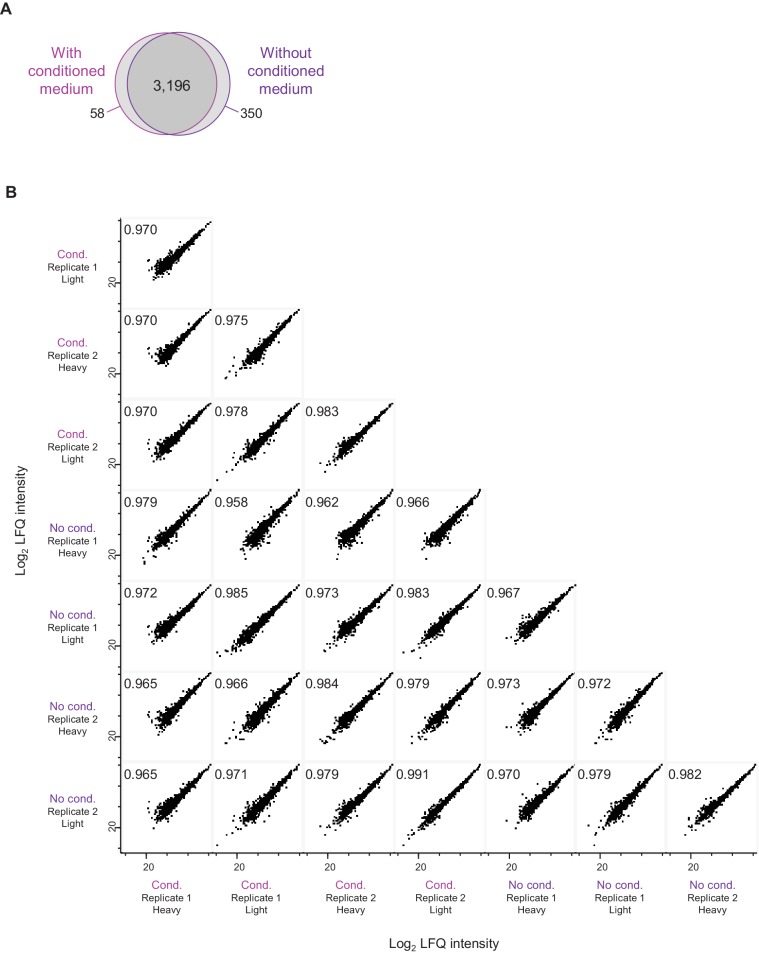
(A) Venn diagram shows the number of detected protein groups in neuron-enriched cultures with and without conditioned medium. (B) Comparison of relative protein abundances. Log2 LFQ intensities are compared between independent samples obtained from neuron-enriched cultures with and without conditioned medium. The Pearson correlation (top left of each diagram) is very high for all pair-wise sample comparisons (≥0.962).
Figure 6—figure supplement 4. Proteomic comparison of glia-enriched cultures prepared from cortex and hippocampus.

Figure 6—figure supplement 4.

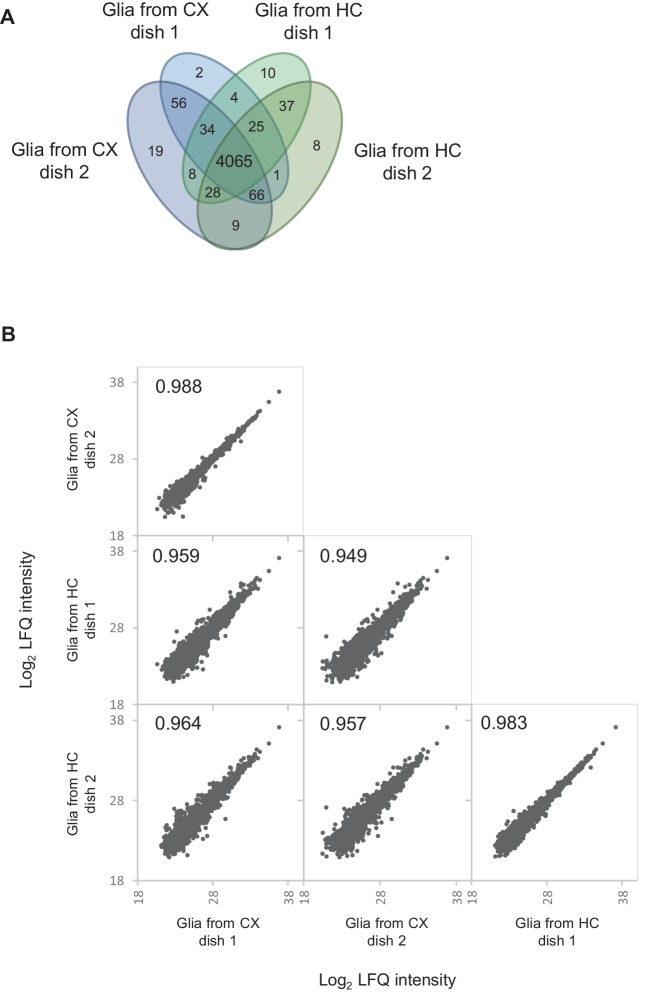
Proteomic comparison between glia-enriched cultures prepared from cortex and hippocampus reveals high similarity between these cultures. (A) Venn diagram showing the number of quantified proteins in each two dishes of glia-enriched cultures from cortex and hippocampus, respectively. 97% of the protein were quantified in both cultures types. (B) Correlation of log2 transformed protein LFQ intensities. LFQ intensities show a very high correlation (Pearson correlation ≥0.949) between glia-enriched cultures from cortex and hippocampus.
Figure 6—figure supplement 5. Estimation of cell division in primary cultures.

Figure 6—figure supplement 5.

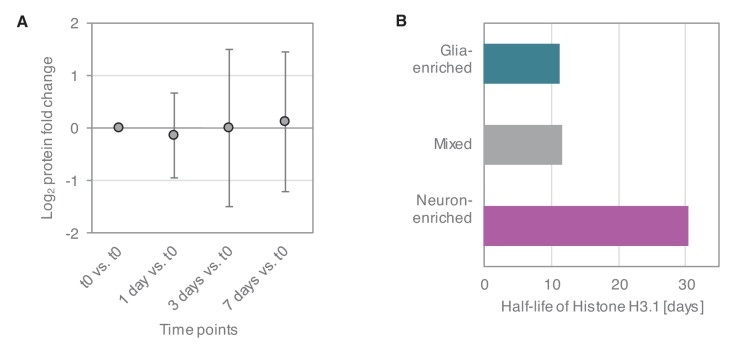
(A) Relative expression levels of glia marker proteins in mixed cultures over the time course of the dynamic SILAC experiment (7 days). Average of log2 fold changes (each time point versus t0) of relative expression levels of 43 astrocyte, oligodendrocyte and microglia markers are shown. Whiskers show the standard deviation. Although different markers show different trends, there is no systematic increase in glia marker proteins over the time course of the SILAC experiment. (B) Protein half-lives of the cell division-dependent Histone H3.1 in the different culture types.