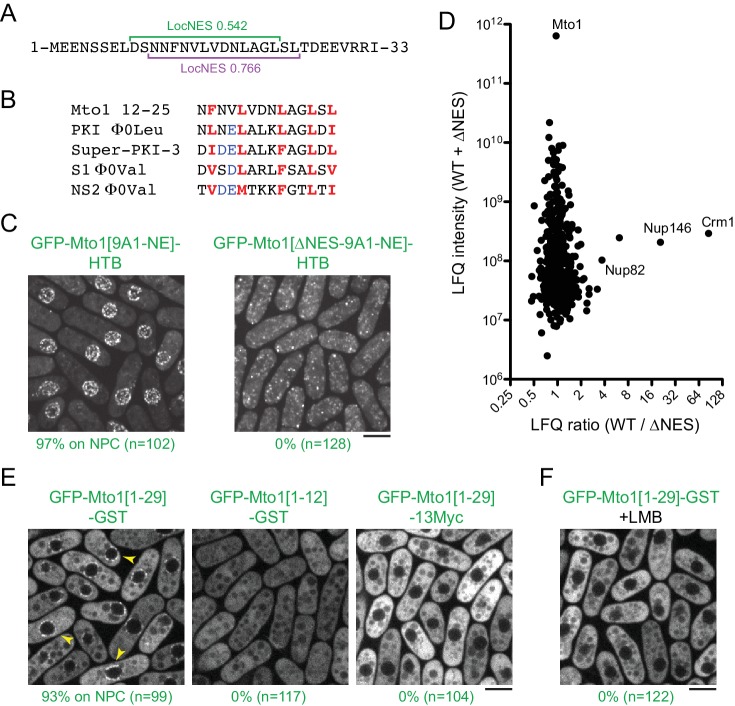
Figure 4. Mto1 interacts with Crm1 via a NES-like sequence near the Mto1 amino-terminus.
(A) Predicted NESs in the first 33 amino acids of Mto1, with associated LocNES scores (Xu et al., 2015). These are the only sequences in the first 130 amino acids of Mto1 with LocNES scores greater than 0.1 (B) Alignment of Mto1 amino acids 12–25 with four non-natural, high-affinity NESs (‘supraphysiological’ NESs) described by Güttler et al. (2010) and Engelsma et al. (2004). Conserved hydrophic residues are indicated in red. Acidic residues shown to enhance NES affinity for Crm1 are in blue. (C) Localization of GFP-Mto1[9A1-NE]-HTB and GFP-Mto1[∆NES-9A1-NE]-HTB, which lacks Mto1 amino acids 1–25. Numbers below images indicate percent cells with Mto1 at NPCs (n = total number of cells scored). (D) Mass spectrometry label-free quantification (LFQ) of 469 proteins from samples of cross-linked, purified GFP-Mto1[9A1-NE]-HTB ('WT’) and cross-linked, purified GFP-Mto1[∆NES-9A1-NE]-HTB ('∆NES’). ‘LFQ ratio’ indicates relative enrichment of a given protein in the purified WT sample compared to the purified ∆NES sample. ‘LFQ intensity’ indicates total intensity (arbitrary units) of a given protein from the combined purified samples. Data shown represent one of two independent biological replicates. Nup82 is labeled because it is likely to interact with Nup146, based on homology with budding yeast (Belgareh et al., 1998). See also Table 3. Complete datasets are in Supplementary file 5. (E) Localization of the indicated Mto1 fragments fused to GFP at their N-termini and either GST or 13Myc at their C-termini. Arrowheads indicate examples of localization to the NPCs. Numbers below images indicate percent cells with Mto1 at NPCs (n = total number of cells scored). (F) Localization of GFP-Mto1[1-29]-GST in leptomycin B-treated cells. Images in E and F are single Z-sections, while other images are maximum projections. Bars, 5 µm.

