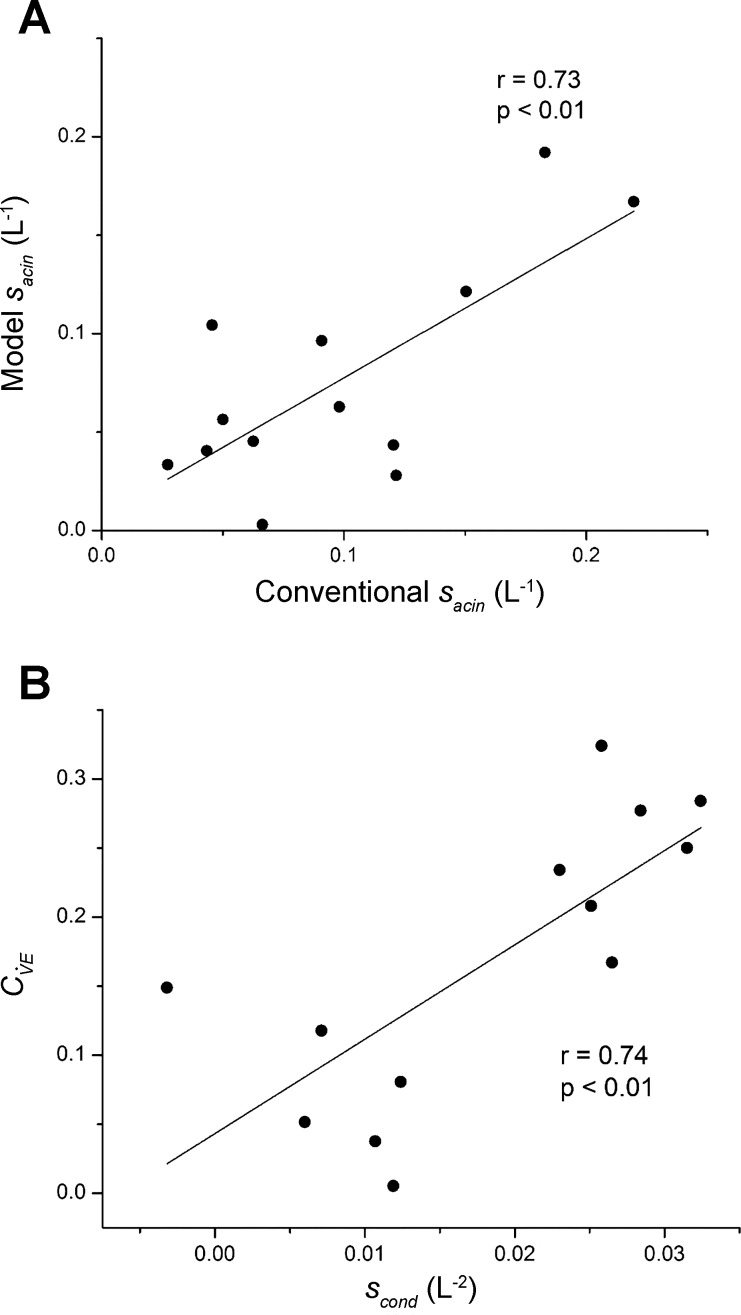
Fig. 7.
A: Sacin determined by fitting the model (Eq. 12) vs. its value determined in the conventional manner from the normalized slopes of Phase III in each breath (symbols), along with their linear regression (line) with intercept = 0.0066 liter−1 and slope = 0.7074. B: coefficient of variation of regional specific ventilation in the model (Eq. 14) vs. Scond determined in the conventional manner from the normalized slopes of Phase III in each breath (symbols), along with their linear regression (line) with intercept = 0.0432 and slope = 6.834 liter−2. The r values shown are Pearson correlation coefficients. Note that the conventional quantities were determined by plotting the normalized Phase III slopes against the cumulative change in lung volume rather than against lung turnover as is usually done. This does not affect the value of Sacin, but it does affect Scond. Conversion of Scond from the former to the latter representation is achieved merely by dividing the former by FRC (i.e., the parameter V0).

