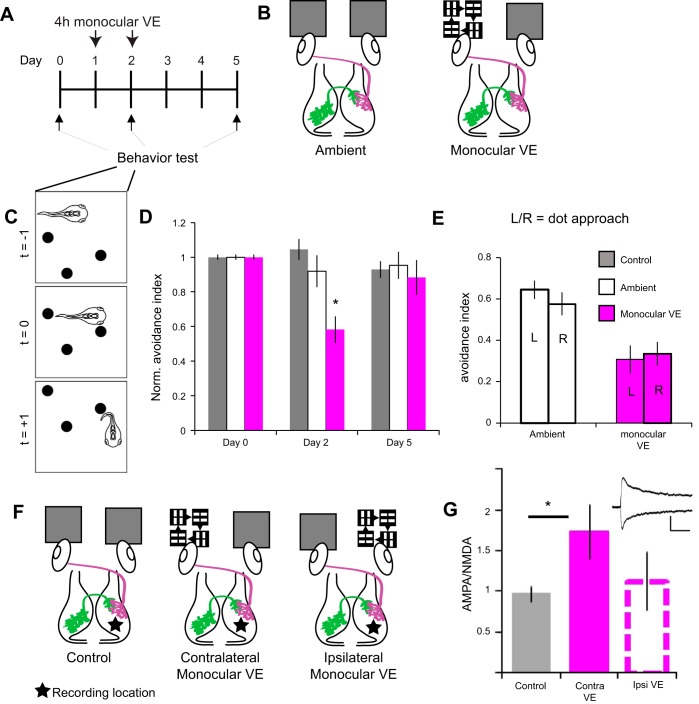
Fig. 2.
Monocular visual experience (VE) disrupts visual avoidance behavior. A and B: experimental timeline and schematic of experimental groups. A: baseline visual avoidance behavior was assayed on day 0. Animals were immobilized in agarose, and the left eye was exposed to 4 h of monocular VE or ambient light on days 1 and 2. Visual avoidance behavior was assayed immediately after monocular VE on day 2 and again on day 5. An additional control group exposed to ambient light was tested. B: schematic of control and monocular VE conditions showing retinotectal axons (magenta) and intertectal axons (green) projecting to the contralateral optic tectum. In the ambient condition, both eyes were exposed to ambient light; for monocular VE, the left eye was exposed to light bars moving in 4 random directions. C: schematic of the avoidance behavioral response to a laterally approaching visual stimulus. Freely swimming tadpoles (t = −1) turn to avoid approaching dots (t = +1) within 500 ms of the stimulus encounter (t = 0). D: monocular VE impairs visual avoidance behavior. Visual avoidance behavior assessed on day 2, right after the 2nd bout of monocular VE, was significantly worse than in tadpoles exposed to ambient light (day 2, *P = 0.006). Avoidance behavior returned to baseline 3 days after monocular VE (day 5). Data were pooled from 3 biological replicates and are normalized to baseline (day 0). Bars represent control, nonimmobilized (gray; n = 28 tadpoles), ambient (white bars, n = 15 tadpoles), and monocular VE conditions (magenta bars, n = 18 tadpoles). E: direction of stimulus approach does not affect avoidance behavior. Stimuli approached the left (L) or right (R) eye. Successful avoidance was similar regardless of the direction of approach for animals exposed to ambient light (P = 0.326) and monocular VE (P = 0.751). F: schematic of experimental groups for electrophysiology experiments. Tadpoles were exposed to ambient light in both eyes (control), monocular VE to the eye contralateral to recording location, or monocular VE to the eye ipsilateral to the recording location. Tectal cell recordings were made at −60 and +40 mV in dissected brains from the right tectal lobe (star) with stimulation electrodes placed on retinotectal (magenta) axons to evoke postsynaptic currents. G: summary data of AMPA-to-NMDA ratios (AMPA/NMDA) recorded 1–3 days after visual stimulation as described in F. Monocular VE increases the retinotectal AMPA/NMDA in the contralateral tectum compared with control (*P = 0.037). Inset: example traces of recordings in control condition at −60 and +40 mV (scale bar: 100 ms, 50 ms). AMPA amplitude was measured as the initial peak; NMDA amplitude was collected in a 20-ms window beginning 50 ms after initial peak AMPA receptor-mediated current. Data are means ± SE for control (n = 22 cells), contralateral VE (n = 20 cells), and ipsilateral VE (n = 16 cells) conditions. A 2-tailed Student’s t-test was used to determine significance.

