Fig. 3.

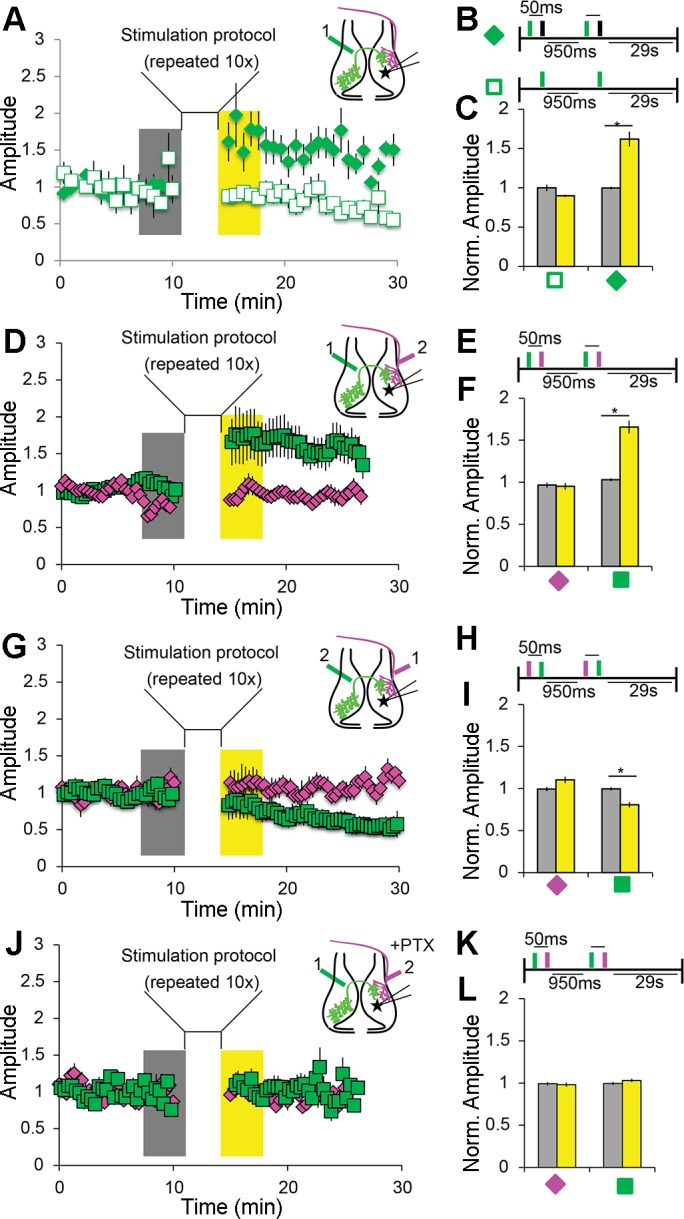
Spike timing-dependent plasticity (STDP) protocols induce intertectal synaptic plasticity. A–C: pairing IT axon stimulation with postsynaptic current injection potentiates IT responses. A: IT axon stimulation was paired with direct depolarizing current injection into tectal neurons in the contralateral tectum. Inset: diagram showing location of IT stimulation (green; 1) and recording location (star). When current injection followed IT stimulation by <50 ms, IT response amplitude was potentiated. Excitatory postsynaptic currents (EPSCs) were recorded in voltage clamp at −60 mV. Stimuli were given at 0.05 Hz. B: schematic showing protocols for pairing depolarization (black bar) and IT stimulation (green bar) and unpaired control. C: summary data showing potentiation of IT responses from cells exposed to the pairing protocol (solid green diamond; n = 16) and no change when unpaired (open square; n = 10). Amplitudes were measured during the time periods highlighted before (gray) and after pairing (yellow) as shown in A. Amplitudes were normalized to baseline before pairing. Only cells that fired action potentials after stimulation were included in the analysis. D–F: pairing IT before retinotectal (RT) stimuli potentiates IT responses. D: pairing protocol as in A, except that current injection is replaced by RT input stimulation. Inset: diagram showing location and timing of IT (1) and RT (2) stimulating electrodes and the recording location (star). E: schematic of pairing protocol with IT stimulation (green bar) preceding RT stimulation (magenta bar). F: summary data showing potentiation of IT responses (green square) and no change in RT responses (magenta diamond) when IT stimulation preceded RT stimulation (interval = 50 ms, n = 25). Data are presented as in C. G–I: pairing RT before IT stimulation depresses IT responses. G: stimulation protocol. Inset: diagram showing location and timing of stimulation electrodes and recording site. H: schematic of pairing protocol. RT stimulation (magenta bar) precedes IT stimulation (green bar). I: summary data as in F showing depression of IT responses but no change in RT responses (n = 7). Data are presented as in C. J–L: pairing-induced IT potentiation requires circuit inhibition. J: stimulation protocol. Inset: diagram showing location and timing of stimulation electrodes and recording site. Recordings were done as in D, with the addition of 100 µM picrotoxin (PTX) in the bath. K: schematic of pairing protocol. IT stimulation precedes RT. L: summary data as in F showing no pairing-induced change in the amplitude of IT or RT PSCs in PTX (n = 13). Data are means ± SE. *P < 0.05 determined using Student’s t-test for PSC amplitude vs. baseline.
