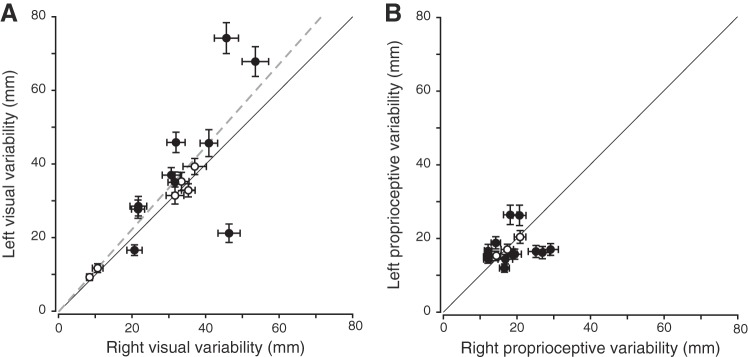
Fig. 8.
Correlations between left and right hand variabilities for vision (A) and proprioception (B) in the active localization task. Error bars are the bootstrapped standard deviations. Dashed gray line illustrates the line of best fit for the significant correlation. Solid black line corresponds to the line of unity, open circles represent participants who do not show left/right difference, and filled circles represent participants showing a significant left/right difference. A: there was a significant correlation between left and right visual variabilities (r = 0.72, P = 0.002; R2 = 0.62, P < 0.001). B: no significant correlation was observed between left and right proprioceptive variabilities (P > 0.05).

