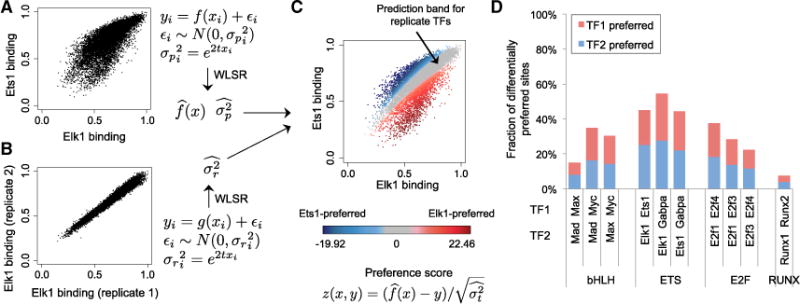
Figure 3. Modeling Differential DNA-Binding Specificity.

(A) Weighted least-square regression (WLSR) is used to fit the gcPBM data of two paralogous TFs (here, Elk1 versus Ets1), and learn a linear or quadratic function , as well as the variance at every data point (i.e., genomic site) i.
(B) WLSR is used to learn the variance structure for replicate gcPBM datasets.
(C) By combining the variance learned from replicate data with the WLSR model for paralogous TFs, we compute a “99% prediction band for replicate TFs” (gray), which contains genomic sites bound similarly by the two TFs. Genomic sites outside the prediction band are preferred by one of the two paralogous TFs (red, Elk1; blue, Ets1). The color intensity reflects the quantitative preference score computed according to the WLSR model. Similar plots for all paralogous TFs pairs are shown in Figure S8.
(D) Fraction of genomic sites, among the sites tested by gcPBM, which are differentially preferred by the paralogous TFs in our study.
