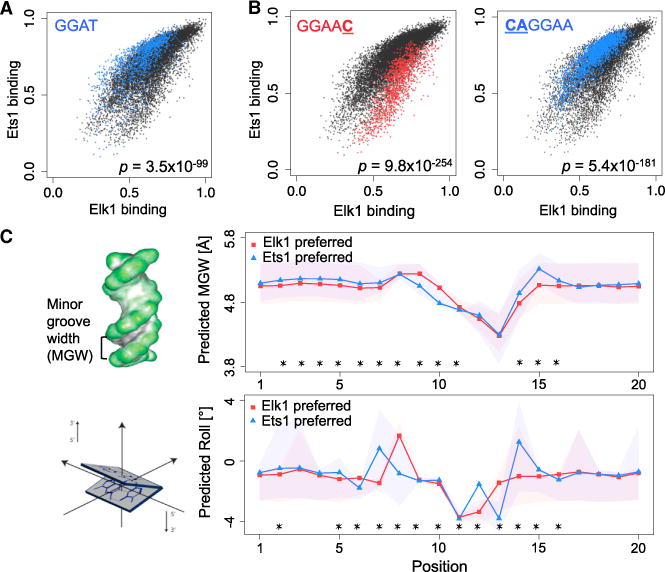
Figure 4. DNA Sequence and Shape Preferences Contribute to the Differential Specificity of Paralogous TFs.

(A) Core motif GGAT shows significant specificity preference for Ets1 versus Elk1. The p value shows the enrichment of the core in Ets1-preferred sites (Mann-Whitney U test).
(B) 1-mer and 2-mer sequences most differentially preferred by Elk1 or Ets1, among sites with the GGAA core. The p values were computed using the Mann-Whitney U test.
(C) Left: schematic of the minor groove width (MGW) and roll structural features. Right: MGW and roll profiles for genomic sites preferred by Elk1 versus Ets1. Asterisks (*) mark the positions within the binding sites (core or flanking region) that are significantly different between the two profiles (p < 10−5; Mann-Whitney U test). Shaded regions show the 25th–75th percentile ranges at each position. See Figure S9 for comparisons of additional paralogous TF pairs.
