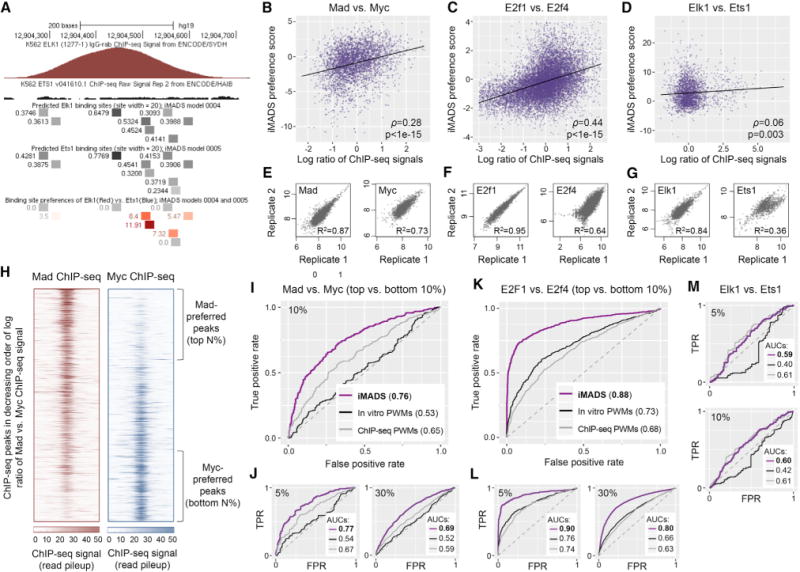
Figure 5. In Vitro Binding Preferences of Paralogous TFs Partly Explain Their Differential In Vivo Binding.

(A) Genomic region bound in vivo by Elk1, but not Ets1 (according to ChIP-seq data [Ayer et al., 1993]) contains binding sites with high preference for Elk1.
(B–D) TF1 versus TF2 in vitro binding preferences, as predicted using our iMADS preference models, have a significant correlation with in vivo binding preferences, as reflected by the log ratios of TF1 versus TF2 ChIP-seq pileup signal (STAR Methods). The Spearman correlation coefficient (ρ) and its statistical significance (p value computed using the asymptotic t approximation [Best and Roberts, 1975]) is shown for each pair of TFs. Due to outlier data points, the scatterplot for E2F factors is limited to peaks with log ratios in the [–3,2.5] interval, and iMADS preference scores in the [–4,4] interval. The full set of peaks, with log ratios in the [–7.79,5.41] interval and iMADS scores in the [–5.89,6.97] interval, are available in Table S5. The full datasets (3,726 peaks for bHLH proteins, 13,004 peaks for E2F proteins, and 2,208 peaks for ETS proteins) were used to assess the correlations and to compute the best fit lines (shown in black).
(E–G) Pearson correlation coefficients between the ChIP-seq pileup signals computed from replicate ChIP-seq datasets. All datasets used in this analysis show good correlation, except for the Ets1 ChIP-seq data. Additional analyses of ChIP-seq data quality are shown in Figure S10.
(H) ChIP-seq data for Mad and Myc, with peaks sorted in decreasing order of the log ratio of Mad versus Myc signal. Regions of 1,000 bp centered at the peak summits are shown. The data can be used to identify “Mad-preferred” and “Myc-preferred” peaks, selected as the top and bottom N% of peaks, respectively. For different values of N, we tested how well iMADS models can distinguish between the peaks preferred by each TF. (I and J) Receiver operating characteristic (ROC) curves showing the performance of iMADS models of differential specificity, as well as PWM models trained on in vitro or in vivo data, in distinguishing Madfrom Myc-preferred peaks. In vitro PWMs were derived from the same gcPBM data used to train iMADS preference models. In vivo PWMs were trained on the ChIP-seq datasets used for testing (STAR Methods). The area under the ROC curve (AUC) is shown for each model. AUC values vary between 0 and 1, with 0.5 corresponding to a random model. Results are shown for N = 5, 10, and 30. (L and K) Similar to (I and J), but for E2F proteins E2f1 versus E2f4.
(M) Similar to (I–K), but for ETS factors Elk1 and Ets1, and showing the results for N = 5 and 10. Additional results are available in Table S6. Additional analyses are shown in Figures S11 and S12.
