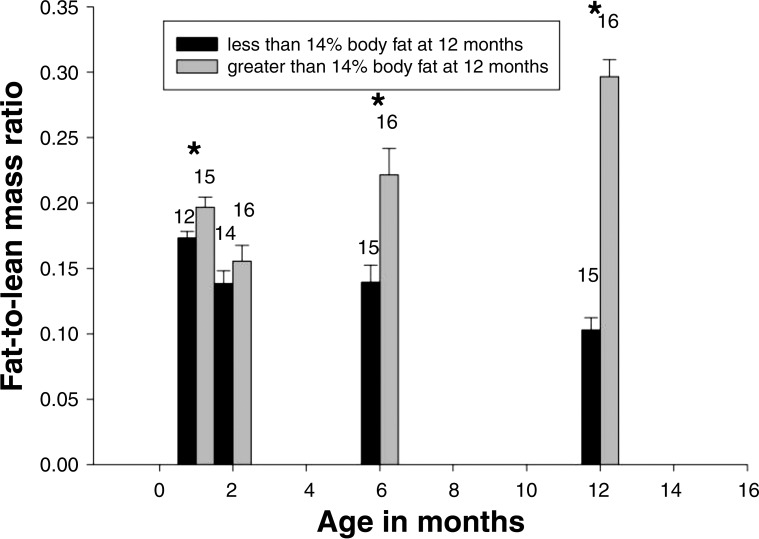
Fig. 2.
Fat-to-lean mass ratio for nonobese (<14% body fat at 12 mo; black bars) and obese (>14% body fat at 12 mo; gray bars) individuals at 1, 2, 6, and 12 mo of age. Standard error of the mean is shown, and the numbers above each bar are the no. of subjects measured. *Significant differences between groups (P<0.05). Figure adapted from Power et al. (42) with permission.

