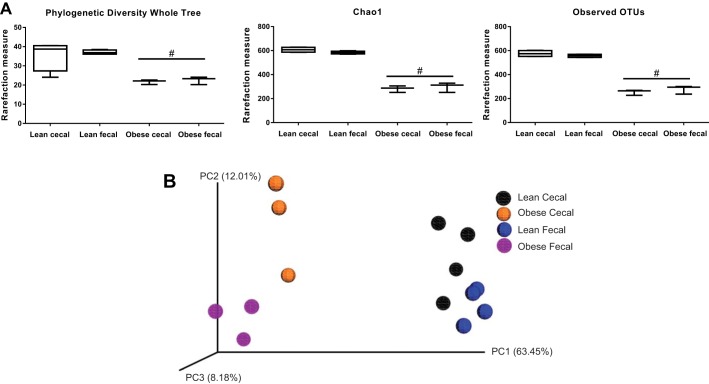
Fig. 1.
Indexes of cecal and fecal alpha-diversity including phylogenetic diversity of whole tree, Chao1, and observed operational taxonomic units (A) and beta diversity of weighted unifrac distances represented as a principal coordinates analysis (PCoA) plot (B) in low fat diet-fed (lean; n = 4 per group) and Western diet-fed (obese; n = 3 per group) pigs for 36 wk. All alpha-diversity/rarefaction box plots are means ± SE #Represents significant (P < 0.05) difference between lean and obese.

