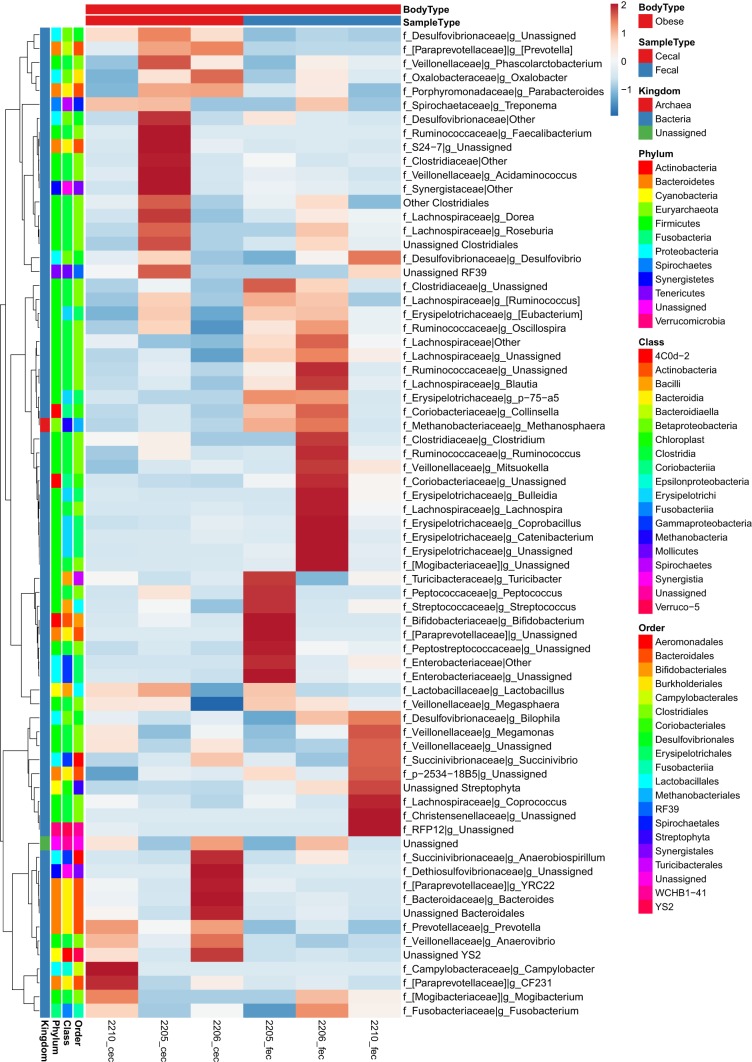
Fig. 6.
Heat map of individual normalized counts of cecal and fecal microbial families and genera from most abundant (top) to least abundant (bottom) in Western diet-fed (obese; n = 3 each) pigs for 36 wk. All values are based off raw operational taxonomic unit (OTU)/relative abundance values. Dark red represents highest abundance, and dark blue is lowest relative abundance.

