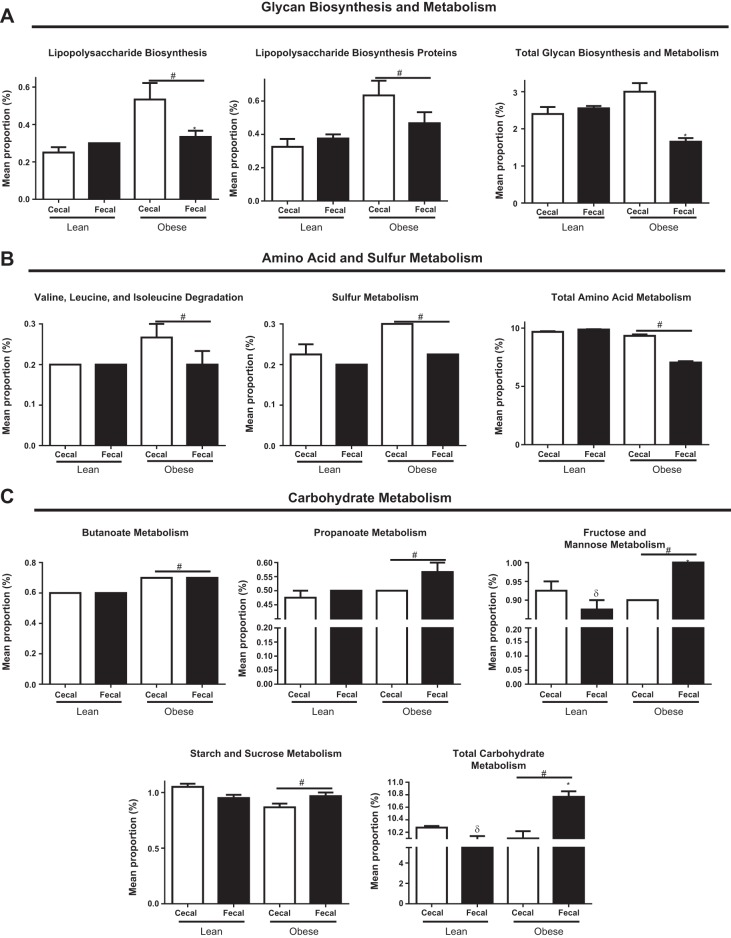
Fig. 7.
Cecal- and fecal-predicted metagenomic differences as measured by phylogenetic investigation of communities by reconstruction of unobserved states (PICRUST) for glycan biosynthesis and metabolism (A), amino acid and sulfur metabolism (B), and carbohydrate metabolism (C) in low fat diet-fed (lean; n = 4 per group) and Western diet-fed (obese; n = 3 per group) for 36 wk. All values are means ± SE *Significant (P < 0.05) difference between obese cecal and obese fecal samples. #Significant (P < 0.05) difference between obese and lean. δSignificant (P < 0.05) difference between lean cecal and lean fecal samples.

