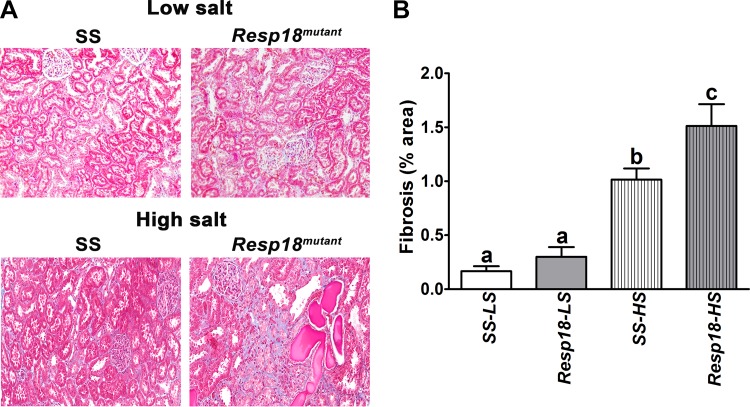
Fig. 3.
Increase in renal fibrosis of Resp18mutant rats compared with SS rats. A: representative images of renal sections obtained from SS and Resp18mutant rats quantified for fibrosis by trichrome staining. B: graphs alongside are fibrosis data quantified from n = 4–6 rats from each group. LS, low salt; HS, high salt. Data are means ± SE. Bars labeled with different letters are significantly different from each other; levels of statistical significance were analyzed by one-way ANOVA *P ≤ 0.05.

