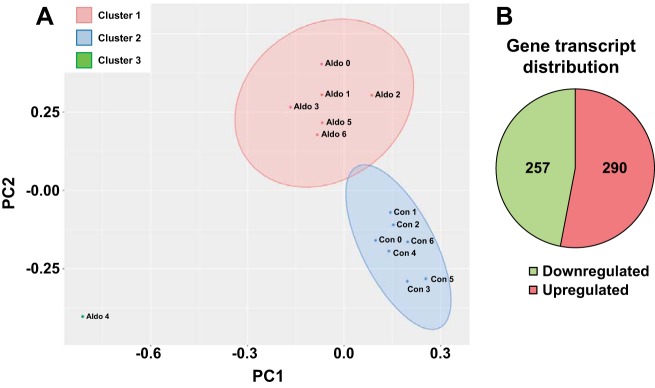
Fig. 3.
Comparison of transcripts in the control and aldosterone-administered group. A: principal component analysis of all transcripts from the control and the aldosterone-administered groups revealed 2 distinct clusters. B: in the DCT2/CNT/iCCD cell population, 257 transcripts were downregulated and 290 were upregulated in response to aldosterone. CNT, connecting tubule; DCT2, late distal convoluted tubule; iCCD, initial cortical collecting duct.

