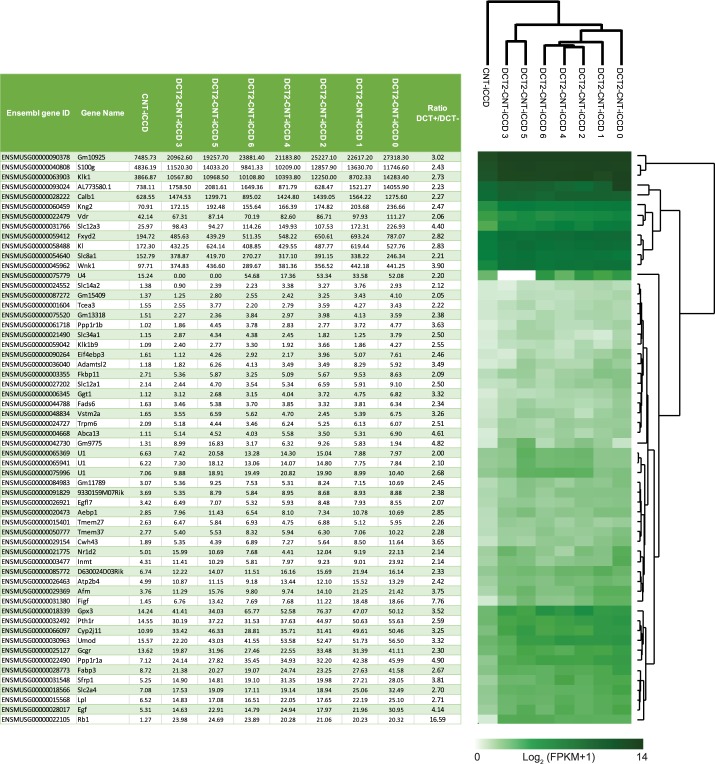
Fig. 8.
Transcripts enriched in the DCT2/CNT/iCCD cell population compared with the CNT/iCCD cell population. Comparison of the DCT2/CNT/iCCD transcriptome of control mice (n = 7) and the CNT/iCCD transcriptome (n = 1). Transcripts enriched in the DCT2 (DCT+/DCT- ratio > 2) are presented in the table (left) and the corresponding heat map (right). CNT, connecting tubule; DCT2, late distal convoluted tubule; FPKM, Fragments Per Kilobase of the transcript per Million mapped reads; iCCD, initial cortical collecting duct.

