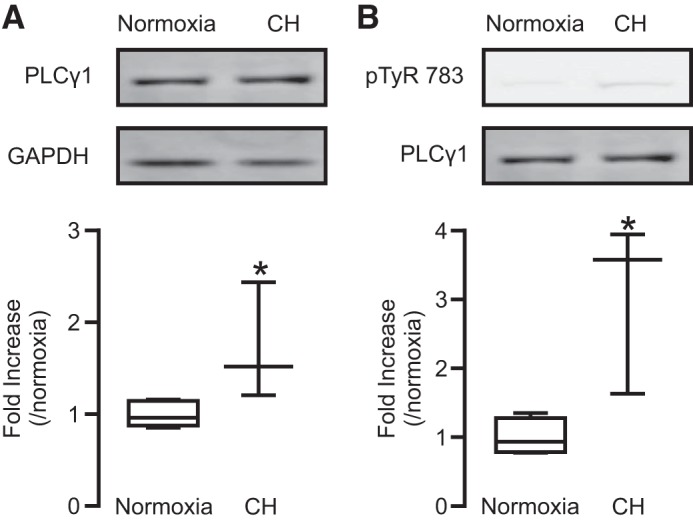
Fig. 7.

Mice exposed CH showed higher expression and basal activity of PLCγ1 in PASMCs than in MASMCs. A: lysates from PASMCs of mice exposed to normoxia and CH were subjected to Western blot analysis. A, top: representative blots of PLCγ1 and GAPDH. A, bottom: quantification of PLCγ1 expression levels in PASMCs from five animals exposed to normoxia and three animals to CH. B, top: representative Western blots of protein expression of PLCγ1 phosphorylated at tyrosine 783 (pTyr-783) and total PLCγ1 in PASMCs from normoxia and CH mice. B, bottom: summary of the fold increase in the ratio of pTyr-783 expression level relative to total PLCγ1 protein expression level in PASMCs. Data were obtained from four mice exposed to normoxia and three mice exposed to CH. *P < 0.05 compared with normoxia.
