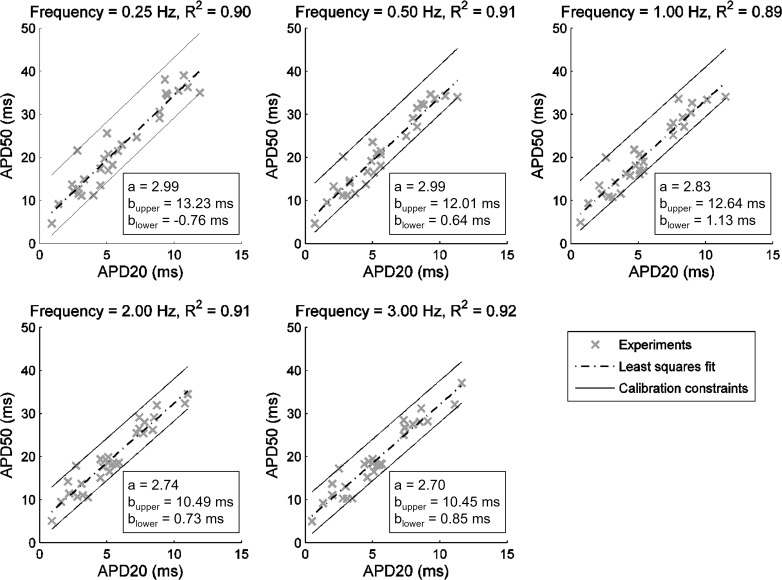
Fig. 2.
Linear relationship between action potential (AP) duration (APD) at 20% and 50% repolarization (APD20 and APD50) properties at five pacing frequencies ex vivo. Experimental data are shown as crosses, dashed-dotted lines are the least-squares fits to the data (corresponding R2 value given at the top of each plot), and solid black lines represent constraints corresponding to aAPD20 + bupper ≥ APD50 ≥ aAPD20 + blower imposed on APD20 and APD50 properties generated by in silico models. The constant a was obtained from the least-squares fit, whereas blower and bupper were determined from the values of the outermost experimental data points.

