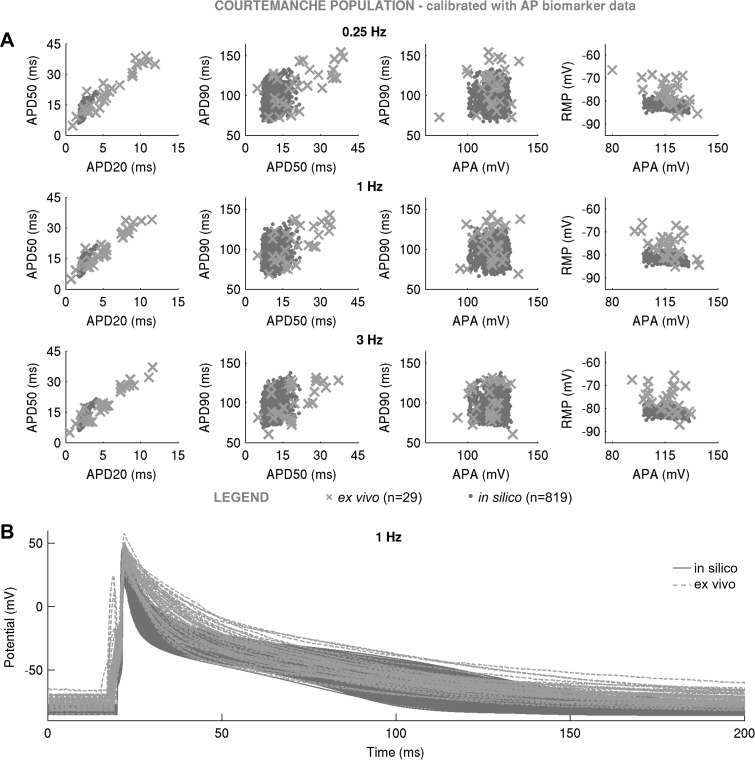
Fig. 7.
In silico action potential (AP) biomarkers at 0.25, 1, and 3 Hz (A) and full AP traces (B) in the Courtemanche-based population of n = 819 models following calibration with AP biomarker data compared with ex vivo measurements. In silico population was generated with sequential Monte Carlo. In silico accepted models, i.e., those models that fulfill experimental AP calibration constraints, are plotted as light gray, whereas ex vivo data are shown as crosses.

