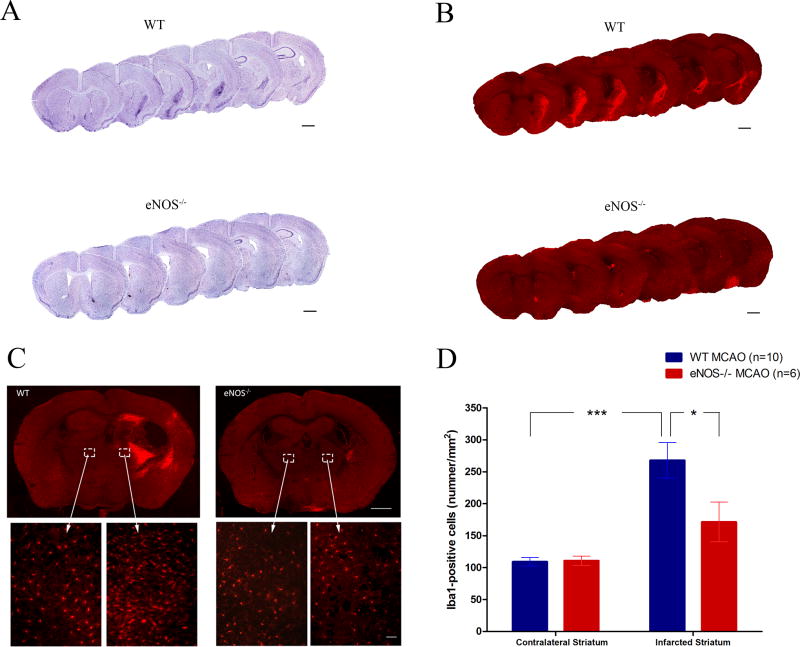
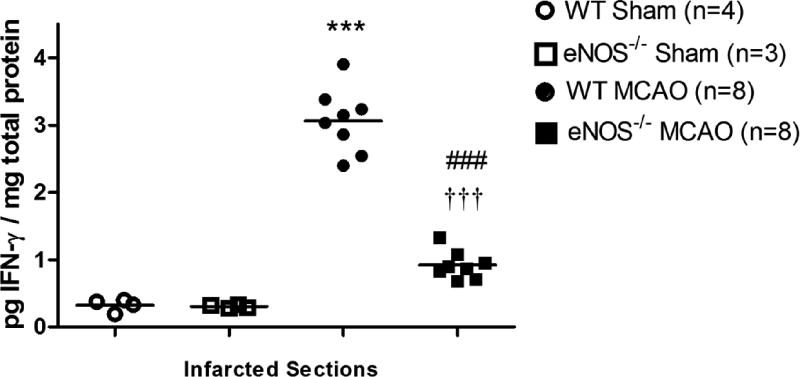
Figure 5.
Microglia accumulation and IFN-γ levels in brain after stroke. (A) Representative Nissl-stained brain sections show the accumulation of cells in the ipsilateral striatum in WT MCAO mice and eNOS-deficient MCAO mice. (B) Immunohistochemical staining of Iba1+ cells in the ipsilateral striatum shows microglial hyper-intensity in WT MCAO, but not in eNOS−/− MCAO mice. (C) Representative images of Iba1 staining in bilateral regions in WT MCAO (n = 10) and eNOS−/− MCAO (n = 6) mice. Scale bar represents 0.05mm. (D) Comparison of the density of Iba1+ cells in the bilateral striatum between WT and eNOS−/− MCAO mice. Iba1+ cell numbers in ipsilateral striatum were significantly higher than in contralateral striatum in WT mice. (E): IFN-γ levels in brain extracts of infarcted sides. Protein was extracted from brain tissue harvested from the infarcted sides and levels of IFN-γ levels measured by ELISA. Data are expressed as the mean ± SEM. * indicates difference from sham WT mice (* P<0.05, ***p < 0.001); # indicates difference from WT MCAO mice (###: P<0.001); † indicates difference from sham eNOS−/− mice (†††: p < 0.001), two-tailed Student’s t-test.


